## Bar Charts: Average Lengths for Correct and Incorrect Thoughts
### Overview
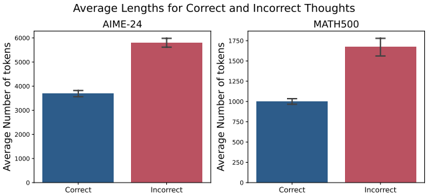
The image contains two side-by-side bar charts comparing the average number of tokens used in "Correct" and "Incorrect" thought processes across two datasets: **AIME-24** (left) and **MATH500** (right). Each chart uses color-coded bars (blue for "Correct," red for "Incorrect") and includes error bars to indicate uncertainty.
### Components/Axes
- **X-Axes**:
- Left chart (AIME-24): Labeled "Correct" and "Incorrect."
- Right chart (MATH500): Same labels.
- **Y-Axes**:
- Left chart: "Average Number of tokens" (scale: 0–6000).
- Right chart: "Average Number of tokens" (scale: 0–1750).
- **Legends**:
- Blue = "Correct" thoughts.
- Red = "Incorrect" thoughts.
- **Error Bars**: Small vertical lines atop each bar, indicating measurement uncertainty.
### Detailed Analysis
#### AIME-24 Chart
- **Correct**: ~3,700 tokens (blue bar).
- **Incorrect**: ~5,800 tokens (red bar).
- **Error Bars**: ±~50 tokens for both categories.
#### MATH500 Chart
- **Correct**: ~1,000 tokens (blue bar).
- **Incorrect**: ~1,650 tokens (red bar).
- **Error Bars**: ±~25 tokens for both categories.
### Key Observations
1. **Higher Token Usage for Incorrect Thoughts**: In both datasets, "Incorrect" thoughts consistently use more tokens than "Correct" ones.
2. **Larger Disparity in AIME-24**: The gap between correct and incorrect tokens is ~2,100 (AIME-24) vs. ~650 (MATH500), suggesting AIME-24 tasks may involve more complex or error-prone reasoning.
3. **Precision**: Error bars are minimal, indicating high confidence in the reported averages.
### Interpretation
The data suggests that incorrect reasoning processes in both datasets are more token-intensive, potentially reflecting:
- **Inefficiency**: Models may expend more computational resources exploring incorrect paths before arriving at a solution.
- **Task Complexity**: AIME-24’s larger gap implies its problems might require deeper or more iterative reasoning, increasing the likelihood of errors and resource consumption.
- **Model Behavior**: The disparity could highlight differences in how models handle correctness vs. errors, such as backtracking or over-exploration of incorrect hypotheses.
The charts emphasize the importance of optimizing token efficiency in reasoning models, particularly for high-stakes or complex tasks like those in AIME-24.