## Line Chart: Global Level Plug Availability
### Overview
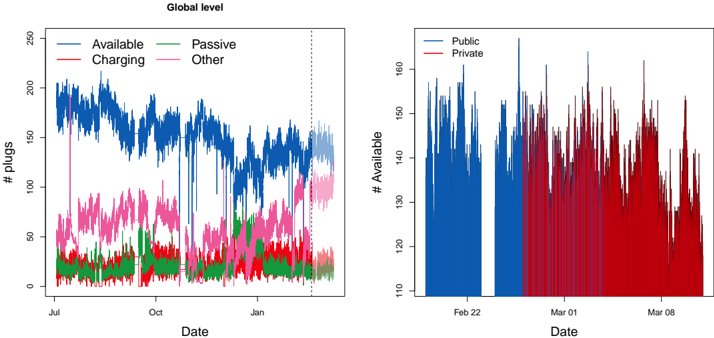
The left chart displays four overlapping time-series data lines representing plug availability categories over a 7-month period (July to January). The right chart shows a comparative bar chart of public vs private plug availability over a 16-day period (Feb 22 - Mar 8).
### Components/Axes
**Left Chart:**
- **Title**: Global level
- **X-axis**: Date (July → October → January)
- **Y-axis**: # plugs (0-250)
- **Legend**:
- Blue: Available
- Green: Passive
- Red: Charging
- Pink: Other
- **Special Element**: Vertical dashed line at October
**Right Chart:**
- **Title**: Public vs Private
- **X-axis**: Date (Feb 22 → Mar 01 → Mar 08)
- **Y-axis**: # Available (110-160)
- **Legend**:
- Blue: Public
- Red: Private
### Detailed Analysis
**Left Chart Trends:**
1. **Available (Blue)**:
- Peaks at ~200 plugs in July
- Drops to ~150 plugs by October (coinciding with vertical dashed line)
- Fluctuates between 140-180 plugs through January
2. **Passive (Green)**:
- Stable between 20-40 plugs throughout
- Minor spike to ~50 plugs in October
3. **Charging (Red)**:
- Consistent 20-30 plugs
- Sharp drop to ~10 plugs in October
4. **Other (Pink)**:
- Ranges 50-70 plugs
- Sharp increase to ~100 plugs in October
**Right Chart Trends:**
1. **Public (Blue)**:
- Starts at ~150 plugs on Feb 22
- Drops to ~120 plugs by Mar 01
- Rises to ~140 plugs by Mar 08
2. **Private (Red)**:
- Starts at ~110 plugs on Feb 22
- Peaks at ~130 plugs around Mar 01
- Drops to ~120 plugs by Mar 08
### Key Observations
1. **October Anomaly**:
- Sharp drop in Available plugs (-25%) and Charging plugs (-60%) in October
- Simultaneous spike in Other plugs (+100%)
- Vertical dashed line suggests a potential policy change or system event
2. **Public-Private Shift**:
- Public availability decreases by 20% over 16 days
- Private availability increases by 18% during same period
- Most significant shift occurs between Feb 22 and Mar 01
3. **Seasonal Pattern**:
- Available plugs show seasonal fluctuation (highest in July, lowest in October)
- Passive plugs remain relatively stable year-round
### Interpretation
The data suggests a complex interplay between public infrastructure management and private adoption. The October anomaly in the left chart likely represents a critical system event (e.g., maintenance, policy change) that temporarily reduced available charging capacity while increasing "Other" category usage. This correlates with the right chart's public-private shift, indicating possible privatization efforts or policy changes affecting public charging infrastructure. The persistent gap between public and private availability (20-30 plugs difference) suggests ongoing transition dynamics in the charging network ecosystem. The seasonal pattern in available plugs may reflect usage patterns tied to tourism or regional climate factors.