\n
## Diagram: Reasoning Phenomena
### Overview
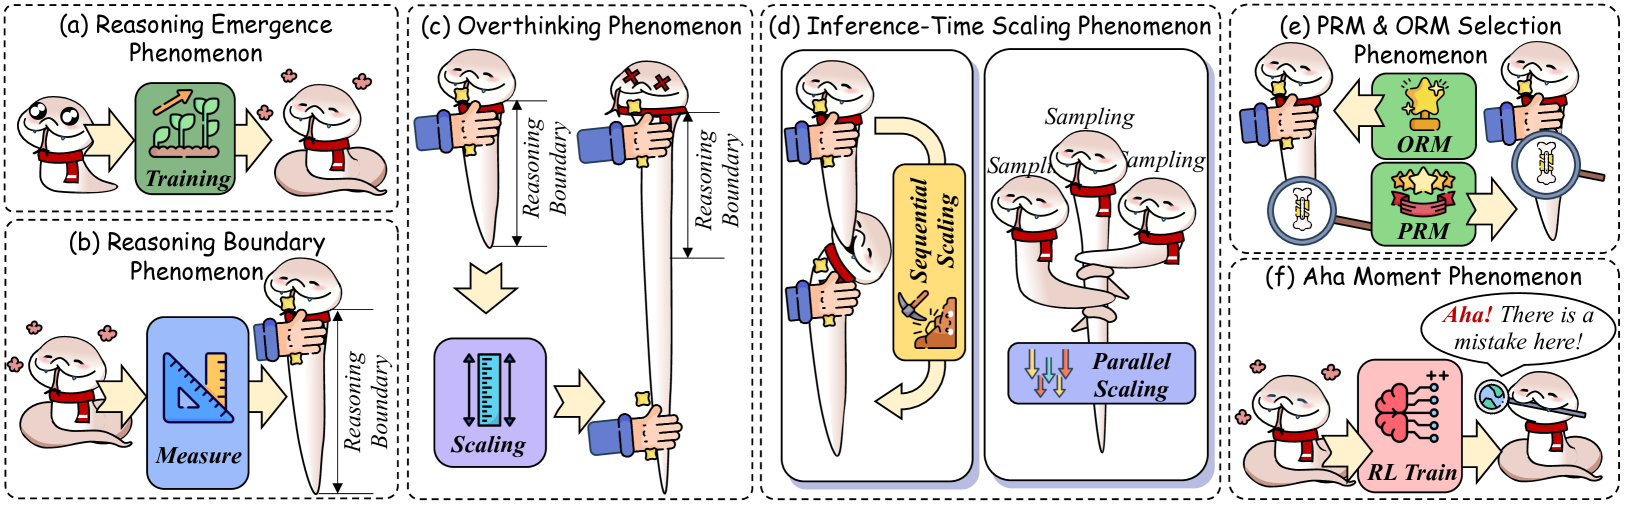
The image presents a diagram illustrating six distinct reasoning phenomena observed in large language models (LLMs). Each phenomenon is depicted as a separate panel (a-f) with a visual metaphor involving a human head/brain and associated elements. The diagram uses a consistent visual style with dashed boxes to delineate each phenomenon.
### Components/Axes
The diagram does not have traditional axes. Instead, it uses visual elements to represent concepts. Key components include:
* **Human Head/Brain:** Represents the LLM's reasoning process.
* **Dashed Boxes:** Enclose each phenomenon, visually separating them.
* **Labels:** Each panel is labeled with a phenomenon name (e.g., "Reasoning Emergence Phenomenon").
* **Text Annotations:** Short phrases within each panel describe specific aspects of the phenomenon (e.g., "Training", "Sampling", "Measure", "Scaling", "RL Train").
* **Visual Metaphors:** Objects like flowers, rulers, scales, and hands are used to represent the reasoning process.
* **ORM & PRM:** Labels for two different model selection approaches.
### Detailed Analysis or Content Details
**(a) Reasoning Emergence Phenomenon:**
* A human head is shown with flowers growing around it.
* A red box labeled "Training" is positioned near the head.
* Flowers are shown emerging from the head.
**(b) Reasoning Boundary Phenomenon:**
* A robotic arm is measuring the size of a human head with a ruler. The label "Measure" is on the red box.
* Another robotic arm is scaling the head with a ruler. The label "Scaling" is on the red box.
* A dashed line labeled "Reasoning Boundary" is shown on the left side of the panel.
**(c) Overthinking Phenomenon:**
* A human head is shown with a large, blue structure extending upwards, labeled "Reasoning Boundary".
* The head appears to be "overwhelmed" by the structure.
**(d) Inference-Time Scaling Phenomenon:**
* A human head is connected to a computer tower.
* The tower has two outputs labeled "Sequential Scaling" and "Parallel Scaling".
* The "Sequential Scaling" output shows a series of steps.
* The "Parallel Scaling" output shows multiple parallel processes.
* The word "Sampling" is repeated above the outputs.
**(e) PRM & ORM Selection Phenomenon:**
* A human head is shown with two options presented: "ORM" (represented by a yellow object) and "PRM" (represented by a red object).
* A hand is pointing towards one of the options.
**(f) Aha Moment Phenomenon:**
* A human head is shown with a lightbulb above it.
* A speech bubble says "Aha! There is a mistake here!".
* Below the head, a brain is shown with a positive and negative symbol, labeled "RL Train".
### Key Observations
* The diagram uses a consistent visual language across all six panels.
* Each phenomenon is presented as a distinct visual metaphor.
* The "Reasoning Boundary" is a recurring theme, appearing in panels (b) and (c).
* The diagram does not provide quantitative data; it is a conceptual illustration.
* The phenomena are presented in a sequential order from left to right.
### Interpretation
The diagram illustrates a series of challenges and observations related to reasoning in large language models. It suggests that reasoning ability doesn't simply scale linearly with model size (Reasoning Emergence, Reasoning Boundary). It highlights the potential for models to become overwhelmed by complexity (Overthinking), the importance of efficient inference (Inference-Time Scaling), the need for careful model selection (PRM & ORM Selection), and the occasional "aha" moments where models identify errors (Aha Moment). The diagram is a high-level conceptual overview and doesn't delve into the technical details of each phenomenon. It serves as a visual summary of research findings in the field of LLM reasoning. The use of visual metaphors makes the concepts more accessible, but also means the diagram is limited in its ability to convey precise information. The diagram is a qualitative exploration of LLM behavior, rather than a quantitative analysis.