\n
## Line Charts: Unlabeled Data Visualizations
### Overview
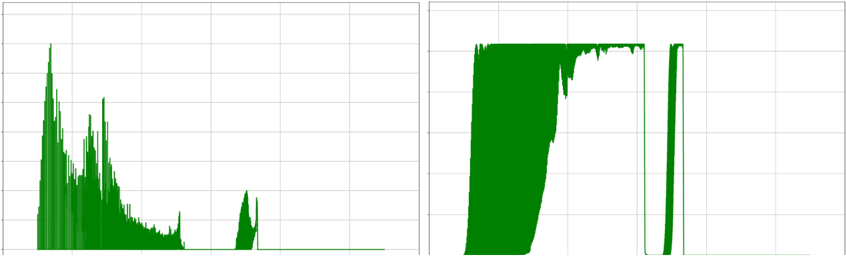
The image presents two separate line charts displayed side-by-side. Both charts utilize a green line against a white grid background. Neither chart has labeled axes or a legend, making precise data interpretation challenging. The charts appear to represent time-series data, but without axis labels, the units and time scales are unknown.
### Components/Axes
There are no visible axis labels, titles, or legends. The charts consist of a grid background and a single green line representing the data series. The grid appears to be a standard Cartesian coordinate system, but the scale is undefined.
### Detailed Analysis or Content Details
**Chart 1 (Left)**
* **Trend:** The line initially rises sharply, reaching a peak around the left-center of the chart. It then fluctuates with several peaks and valleys before declining to a relatively flat baseline towards the right edge.
* **Approximate Data Points (Visual Estimation):**
* Initial rise: From approximately y=0 to a peak around y=8-10 (arbitrary units).
* Fluctuations: Peaks around y=6-8, valleys around y=2-4.
* Final decline: Reaches a baseline around y=0-1.
* A small spike appears near the right edge, reaching approximately y=5.
**Chart 2 (Right)**
* **Trend:** The line starts at a low value and rises rapidly to a high plateau. It remains relatively stable for a significant portion of the chart before exhibiting two sharp, vertical spikes at the right edge.
* **Approximate Data Points (Visual Estimation):**
* Initial rise: From approximately y=0 to a plateau around y=8-10.
* Plateau: Remains relatively constant at y=8-10 for the majority of the chart.
* Spikes: Two vertical spikes reaching approximately y=12-14.
### Key Observations
* Both charts display dynamic data with variations over time (assuming the x-axis represents time).
* Chart 1 exhibits more frequent fluctuations than Chart 2.
* Chart 2 shows a period of stability followed by sudden, significant increases.
* The lack of labels severely limits the ability to draw meaningful conclusions.
### Interpretation
Without axis labels or a legend, it is impossible to determine the meaning of the data presented in these charts. They could represent any number of variables over time, such as temperature, stock prices, sensor readings, or population growth. The patterns observed suggest potential events or changes occurring within the system being measured.
Chart 1's fluctuating pattern could indicate cyclical behavior or responses to external stimuli. The spike at the end might represent an anomaly or a sudden event.
Chart 2's stable plateau followed by spikes suggests a system that maintained a consistent state for a period before experiencing rapid changes. These spikes could represent critical thresholds being exceeded or the occurrence of significant events.
The relationship between the two charts is unclear without additional context. They might represent different aspects of the same system or entirely unrelated phenomena.
In conclusion, while the charts visually demonstrate data trends, their lack of labeling renders them largely uninterpretable without further information. They are essentially abstract representations of data without a defined meaning.