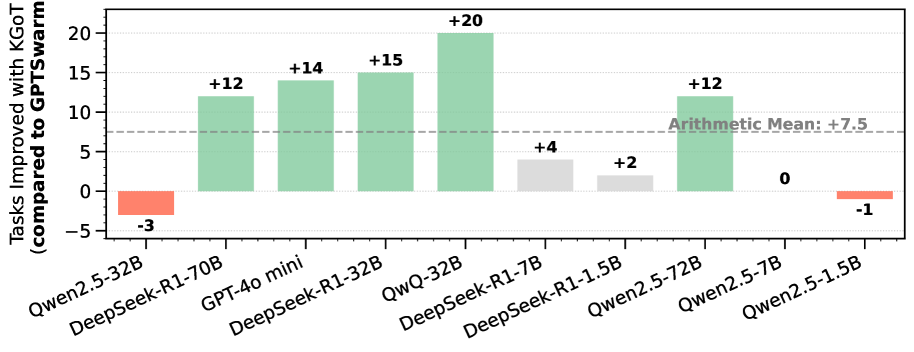
## Bar Chart: Tasks Improved with KGOT (compared to GPTSwarm)
### Overview
The image is a bar chart comparing the performance of different language models on a set of tasks when using KGOT, relative to their performance using GPTSwarm. The y-axis represents the improvement in tasks, and the x-axis lists the different language models. The chart also includes a horizontal line indicating the arithmetic mean of the improvements.
### Components/Axes
* **Y-axis:** "Tasks Improved with KGOT (compared to GPTSwarm)". The scale ranges from -5 to 20, with gridlines at intervals of 5.
* **X-axis:** Lists the following language models:
* Qwen2.5-32B
* DeepSeek-R1-70B
* GPT-4o mini
* DeepSeek-R1-32B
* QwQ-32B
* DeepSeek-R1-7B
* DeepSeek-R1-1.5B
* Qwen2.5-72B
* Qwen2.5-7B
* Qwen2.5-1.5B
* **Bars:** Each bar represents the performance improvement of a specific language model. The bars are colored green for positive improvements, red for negative improvements, and gray for smaller positive improvements.
* **Arithmetic Mean Line:** A horizontal dashed line is present at y = 7.5, labeled "Arithmetic Mean: +7.5".
### Detailed Analysis
Here's a breakdown of the performance improvements for each language model:
* **Qwen2.5-32B:** -3 (Red bar, indicating a decrease in performance)
* **DeepSeek-R1-70B:** +12 (Green bar, indicating an improvement)
* **GPT-4o mini:** +14 (Green bar, indicating an improvement)
* **DeepSeek-R1-32B:** +15 (Green bar, indicating an improvement)
* **QwQ-32B:** +20 (Green bar, indicating the highest improvement)
* **DeepSeek-R1-7B:** +4 (Gray bar, indicating a smaller improvement)
* **DeepSeek-R1-1.5B:** +2 (Gray bar, indicating a smaller improvement)
* **Qwen2.5-72B:** +12 (Green bar, indicating an improvement)
* **Qwen2.5-7B:** 0 (No improvement)
* **Qwen2.5-1.5B:** -1 (Red bar, indicating a decrease in performance)
### Key Observations
* QwQ-32B shows the highest improvement with a value of +20.
* Qwen2.5-32B and Qwen2.5-1.5B show a decrease in performance with values of -3 and -1, respectively.
* The arithmetic mean of the improvements is +7.5.
* The majority of the models show a positive improvement when using KGOT compared to GPTSwarm.
### Interpretation
The bar chart illustrates the impact of using KGOT on the performance of various language models. The positive values indicate that KGOT generally improves performance compared to GPTSwarm. However, some models (Qwen2.5-32B and Qwen2.5-1.5B) experience a decrease in performance, suggesting that KGOT may not be universally beneficial and its effectiveness can depend on the specific model architecture or size. The arithmetic mean provides a general sense of the average improvement across all models tested. The significant improvement observed with QwQ-32B suggests that KGOT is particularly well-suited for this model. The gray bars indicate smaller improvements, suggesting that KGOT's impact is less pronounced on those models.