## Data Flow Diagram: Problem Filtering Process
### Overview
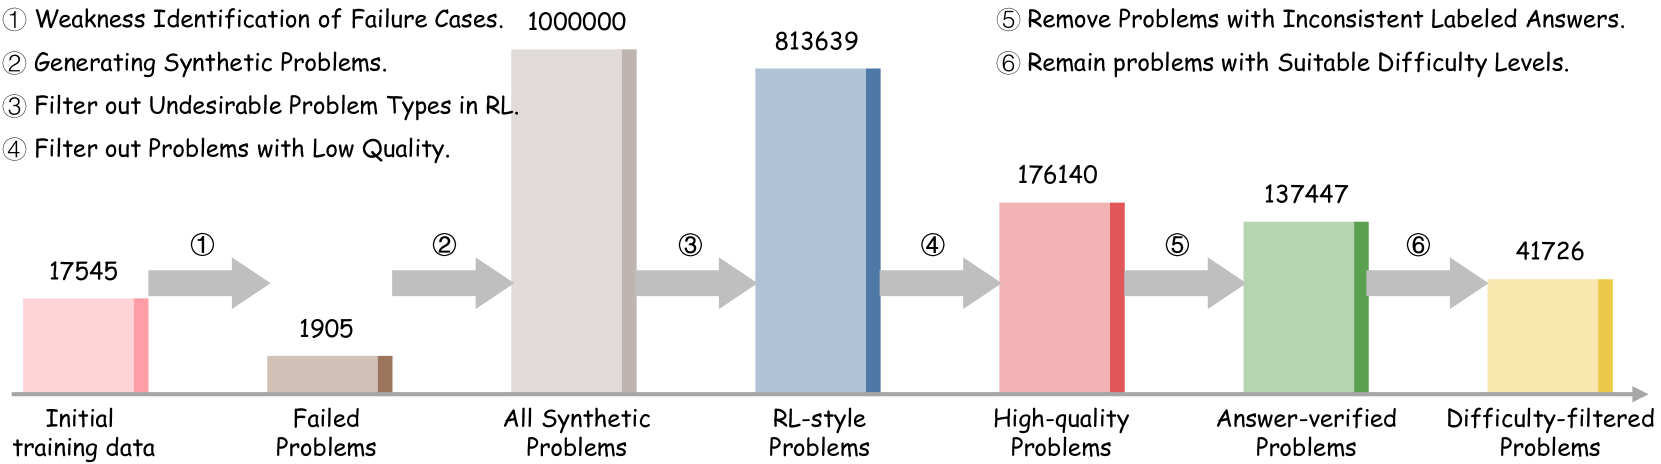
The image is a data flow diagram illustrating the process of filtering problems, starting from initial training data and ending with difficulty-filtered problems. The diagram shows the number of problems at each stage, with arrows indicating the flow and filtering steps.
### Components/Axes
* **Horizontal Axis:** Represents the different stages of the problem filtering process.
* Initial training data
* Failed Problems
* All Synthetic Problems
* RL-style Problems
* High-quality Problems
* Answer-verified Problems
* Difficulty-filtered Problems
* **Vertical Axis:** Represents the number of problems at each stage. The exact scale is not provided, but the values are labeled above each bar.
* **Filtering Steps (Numbered):**
1. Weakness Identification of Failure Cases.
2. Generating Synthetic Problems.
3. Filter out Undesirable Problem Types in RL.
4. Filter out Problems with Low Quality.
5. Remove Problems with Inconsistent Labeled Answers.
6. Remain problems with Suitable Difficulty Levels.
* **Bars:** Represent the number of problems at each stage. The bars are colored differently for each stage:
* Initial training data: Light Pink
* Failed Problems: Light Brown
* All Synthetic Problems: Light Gray
* RL-style Problems: Light Blue
* High-quality Problems: Light Red
* Answer-verified Problems: Light Green
* Difficulty-filtered Problems: Light Yellow
* **Arrows:** Indicate the flow of problems from one stage to the next. Each arrow is labeled with the corresponding filtering step number.
### Detailed Analysis or Content Details
* **Initial training data:** 17545 (Light Pink)
* **Failed Problems:** 1905 (Light Brown)
* **All Synthetic Problems:** 1000000 (Light Gray)
* **RL-style Problems:** 813639 (Light Blue)
* **High-quality Problems:** 176140 (Light Red)
* **Answer-verified Problems:** 137447 (Light Green)
* **Difficulty-filtered Problems:** 41726 (Light Yellow)
The data flow is as follows:
1. Initial training data (17545) -> Failed Problems (1905)
2. Failed Problems (1905) -> All Synthetic Problems (1000000)
3. All Synthetic Problems (1000000) -> RL-style Problems (813639)
4. RL-style Problems (813639) -> High-quality Problems (176140)
5. High-quality Problems (176140) -> Answer-verified Problems (137447)
6. Answer-verified Problems (137447) -> Difficulty-filtered Problems (41726)
### Key Observations
* The number of problems increases dramatically after generating synthetic problems (step 2), going from 1905 to 1000000.
* The number of problems decreases significantly after filtering out undesirable problem types in RL (step 3), from 1000000 to 813639.
* The number of problems continues to decrease through the remaining filtering steps, with the final number of difficulty-filtered problems being 41726.
### Interpretation
The diagram illustrates a multi-stage filtering process designed to refine a set of problems for a specific purpose, likely related to reinforcement learning (RL). The initial training data is augmented by generating synthetic problems, which greatly increases the dataset size. Subsequent filtering steps remove undesirable, low-quality, and inconsistent problems, ultimately resulting in a smaller, more refined set of difficulty-filtered problems. The large reduction in problem count at each stage suggests that the filtering criteria are stringent, ensuring the final set of problems is of high quality and suitable for the intended application. The process highlights the importance of data cleaning and refinement in machine learning workflows.