## Flowchart: Data Processing Pipeline for Reinforcement Learning Problems
### Overview
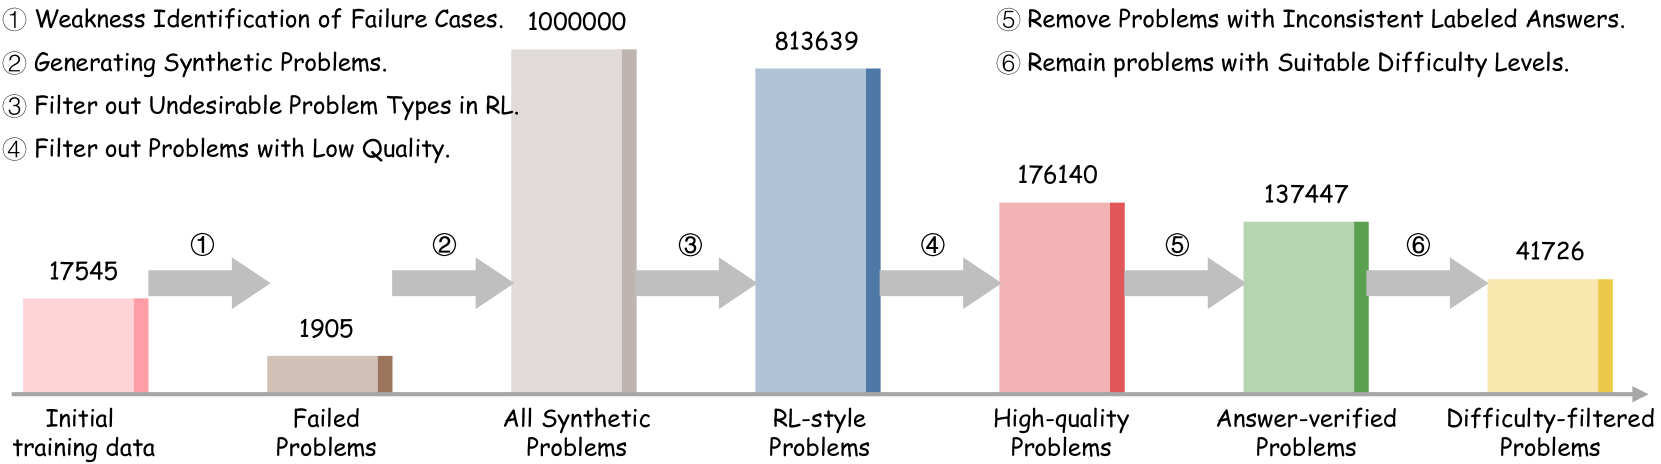
The flowchart illustrates a six-stage pipeline for processing reinforcement learning (RL) problems, starting with initial training data and ending with difficulty-filtered problems. Each stage involves filtering, transformation, or verification, with numerical values representing the quantity of problems at each step.
### Components/Axes
- **X-axis**: Stages of the pipeline (categorical labels: "Initial training data," "Failed Problems," "All Synthetic Problems," "RL-style Problems," "High-quality Problems," "Answer-verified Problems," "Difficulty-filtered Problems").
- **Y-axis**: Quantity of problems (numerical values, ranging from 1,7545 to 1,000,000).
- **Colors**: Each stage is represented by a distinct color (pink, brown, gray, blue, red, green, yellow), though no explicit legend is provided. Colors are spatially grounded to their respective stages.
### Detailed Analysis
1. **Initial training data**: 17,545 problems (pink bar).
2. **Step 1 (Weakness Identification)**: 1,905 failed problems (brown bar), representing a 90% reduction from initial data.
3. **Step 2 (Generating Synthetic Problems)**: 1,000,000 problems (gray bar), a 525x increase from failed problems.
4. **Step 3 (Filter out Undesirable Types in RL)**: 813,639 problems (blue bar), a 186,361 reduction from synthetic problems.
5. **Step 4 (Filter out Low Quality)**: 176,140 problems (red bar), a 637,499 reduction from RL-style problems.
6. **Step 5 (Remove Inconsistent Answers)**: 137,447 problems (green bar), a 38,693 reduction from high-quality problems.
7. **Step 6 (Difficulty Filtering)**: 41,726 problems (yellow bar), a 95,721 reduction from answer-verified problems.
### Key Observations
- **Exponential Growth**: The largest jump occurs at Step 2 (synthetic problem generation), increasing from 1,905 to 1,000,000 problems.
- **Progressive Filtering**: Each subsequent step reduces the problem count, with the steepest drop between Steps 3 and 4 (637,499 problems filtered).
- **Final Output**: Only 41,726 problems (2.38% of initial data) survive all filters, indicating stringent criteria.
### Interpretation
This pipeline demonstrates a rigorous process for curating high-quality RL problems. The initial focus on identifying weaknesses and generating synthetic data suggests an emphasis on expanding problem diversity. However, the aggressive filtering stages (e.g., removing low-quality or inconsistent problems) highlight the importance of quality control in RL datasets. The final difficulty-filtered set likely represents a balanced subset suitable for training robust models. The 90% reduction from initial to failed problems implies that most initial data is discarded early, possibly due to irrelevance or poor quality. The pipeline’s structure aligns with best practices in machine learning, where data refinement is critical for model performance.