\n
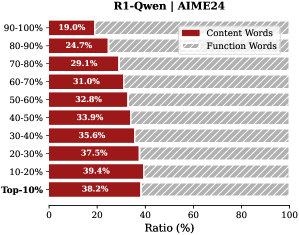
## Horizontal Bar Chart: Content vs. Function Word Ratio
### Overview
The image presents a horizontal bar chart comparing the ratio of content words to function words across different percentage ranges. The chart is titled "R1-Qwen | AIME24". Each bar represents a percentage range, with the length of the red segment indicating the ratio of content words and the grey segment representing the ratio of function words.
### Components/Axes
* **X-axis:** Ratio (%) - Scale ranges from 0 to 100.
* **Y-axis:** Percentage Ranges - Listed as: Top >10%, 10-20%, 20-30%, 30-40%, 40-50%, 50-60%, 60-70%, 70-80%, 80-90%, 90-100%.
* **Legend:** Located in the top-right corner.
* Red: Content Words
* Grey: Function Words
### Detailed Analysis
The chart displays the following data points. The trend is that the ratio of content words decreases as the percentage range increases.
* **Top >10%:** Content Words: 38.2%, Function Words: ~61.8%
* **10-20%:** Content Words: 39.4%, Function Words: ~60.6%
* **20-30%:** Content Words: 37.5%, Function Words: ~62.5%
* **30-40%:** Content Words: 35.6%, Function Words: ~64.4%
* **40-50%:** Content Words: 33.9%, Function Words: ~66.1%
* **50-60%:** Content Words: 32.8%, Function Words: ~67.2%
* **60-70%:** Content Words: 31.0%, Function Words: ~69.0%
* **70-80%:** Content Words: 29.1%, Function Words: ~70.9%
* **80-90%:** Content Words: 24.7%, Function Words: ~75.3%
* **90-100%:** Content Words: 19.0%, Function Words: ~81.0%
### Key Observations
* The highest ratio of content words is observed in the "Top >10%" range (38.2%).
* The lowest ratio of content words is observed in the "90-100%" range (19.0%).
* There is a consistent downward trend in the content word ratio as the percentage range increases.
* The function word ratio consistently increases as the percentage range increases.
### Interpretation
The data suggests that in the analyzed text (R1-Qwen | AIME24), the proportion of content words decreases as one considers words appearing less frequently. This implies that the most common words in the text are predominantly function words (articles, prepositions, conjunctions, etc.), while less frequent words are more likely to be content words (nouns, verbs, adjectives, etc.). This is a common characteristic of natural language, where a small set of function words accounts for a large proportion of the total word count. The chart provides a quantitative view of this distribution, showing how the balance shifts as one moves from the most frequent to the least frequent words. The consistent trend suggests a relatively stable linguistic structure within the analyzed text.