\n
## Diagram: Taxonomic Relationship
### Overview
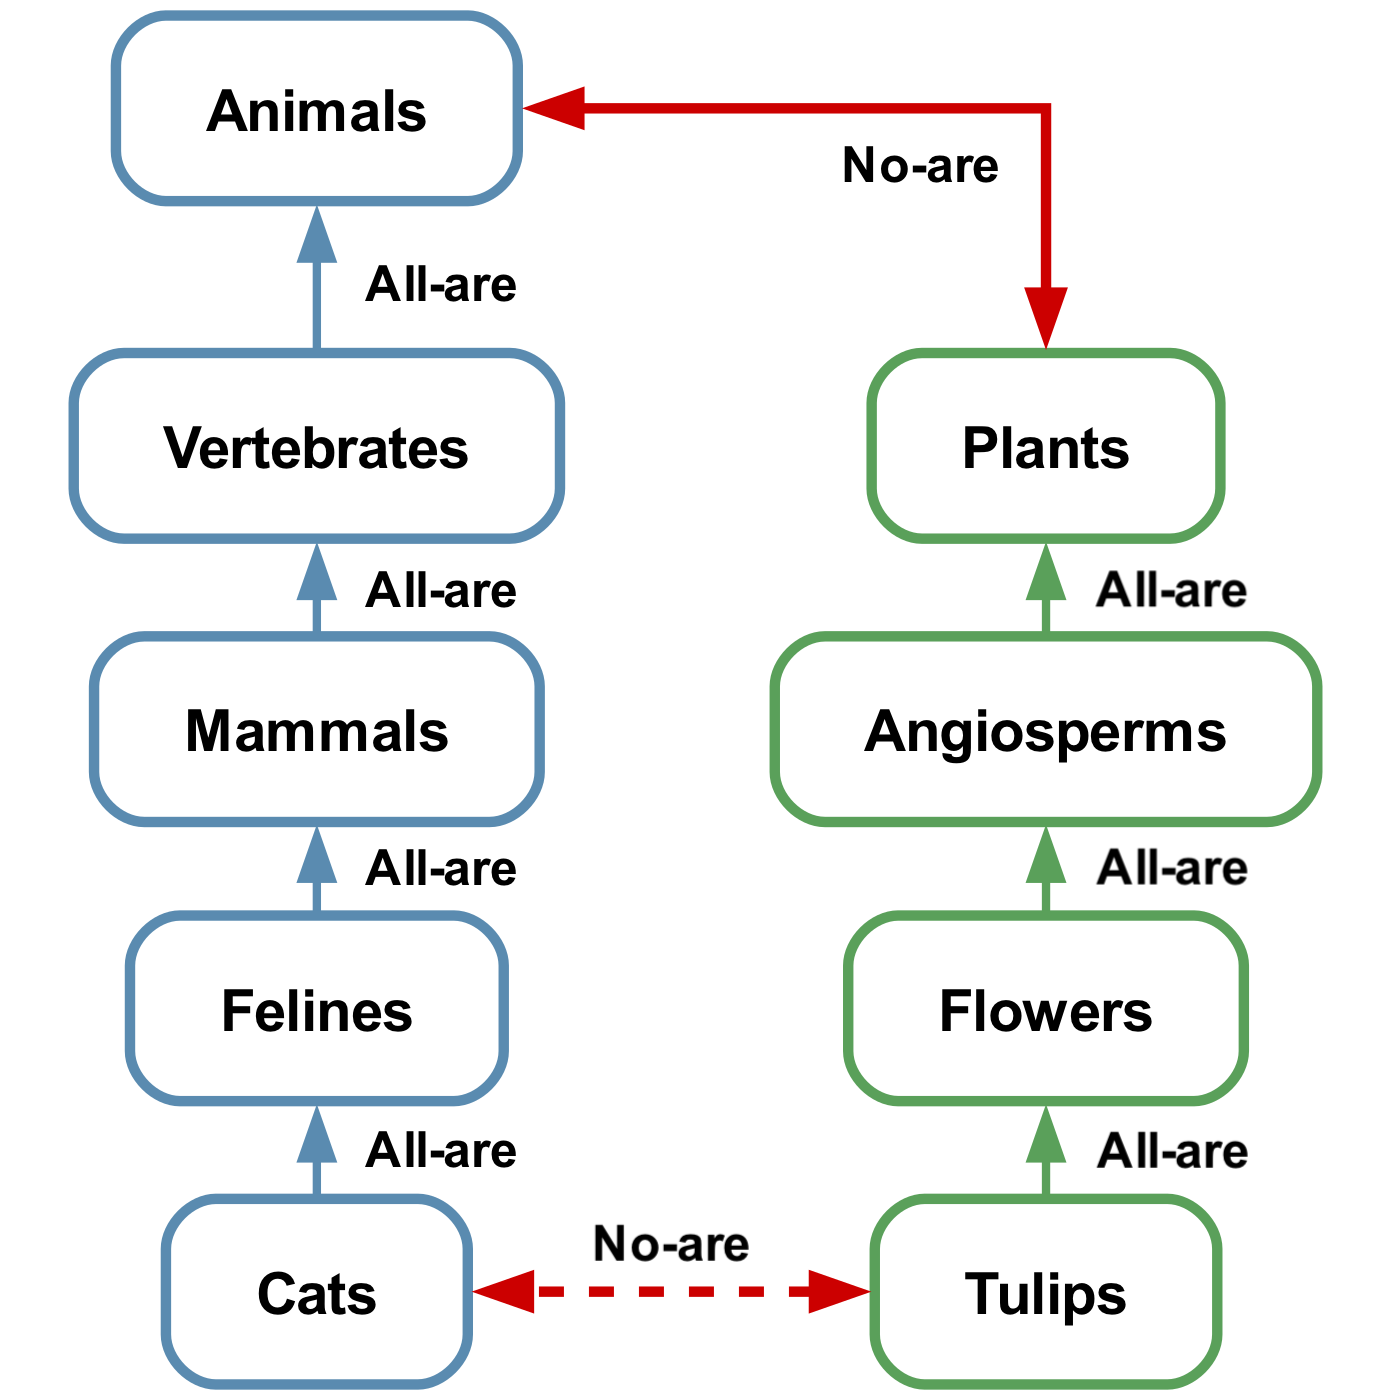
The image is a diagram illustrating a taxonomic relationship between different biological classifications. It uses a series of connected boxes representing categories, with arrows indicating "All-are" and "No-are" relationships between them. The diagram shows a branching structure, starting with broad categories like "Animals" and "Plants" and narrowing down to specific examples like "Cats" and "Tulips".
### Components/Axes
The diagram consists of the following categories:
* Animals
* Vertebrates
* Mammals
* Felines
* Cats
* Plants
* Angiosperms
* Flowers
* Tulips
There are two types of arrows:
* **Green Arrows:** Labeled "All-are", indicating that all members of the source category are also members of the destination category.
* **Red Arrows:** Labeled "No-are", indicating that no members of the source category are members of the destination category. One red arrow is dashed.
### Detailed Analysis or Content Details
The diagram shows the following relationships:
1. **Animals -> Vertebrates:** "All-are" (Green arrow pointing upwards)
2. **Vertebrates -> Mammals:** "All-are" (Green arrow pointing upwards)
3. **Mammals -> Felines:** "All-are" (Green arrow pointing upwards)
4. **Felines -> Cats:** "All-are" (Green arrow pointing upwards)
5. **Animals -> Plants:** "No-are" (Red arrow pointing rightwards)
6. **Plants -> Angiosperms:** "All-are" (Green arrow pointing upwards)
7. **Angiosperms -> Flowers:** "All-are" (Green arrow pointing upwards)
8. **Flowers -> Tulips:** "All-are" (Green arrow pointing upwards)
9. **Cats -> Tulips:** "No-are" (Dashed Red arrow pointing rightwards)
The boxes are arranged in two vertical columns. The left column represents the animal kingdom, and the right column represents the plant kingdom.
### Key Observations
The diagram clearly demonstrates a hierarchical classification system. The "All-are" relationships establish a nested structure, where each category is a subset of the category above it. The "No-are" relationships highlight distinctions between the two main branches (Animals and Plants) and between specific categories within those branches (Cats and Tulips). The dashed red arrow between Cats and Tulips suggests a stronger distinction or exception to a potential overlap.
### Interpretation
This diagram illustrates the fundamental principles of biological taxonomy. It shows how organisms are categorized based on shared characteristics, creating a system of classification that reflects evolutionary relationships. The "All-are" relationships represent the concept of inheritance, where traits are passed down from broader categories to more specific ones. The "No-are" relationships emphasize the boundaries between different groups, highlighting the unique characteristics that define each category.
The diagram is a simplified representation of a complex system, but it effectively conveys the core idea of taxonomic classification. It demonstrates how scientists organize and understand the diversity of life on Earth. The use of arrows and labels makes the relationships clear and easy to follow. The dashed line between Cats and Tulips could indicate a deliberate emphasis on their distinctness, perhaps to counter a common misconception or to highlight a specific biological difference. The diagram is a visual aid for understanding the hierarchical structure of life and the relationships between different organisms.