# Technical Document: Flowchart Analysis
## Overview
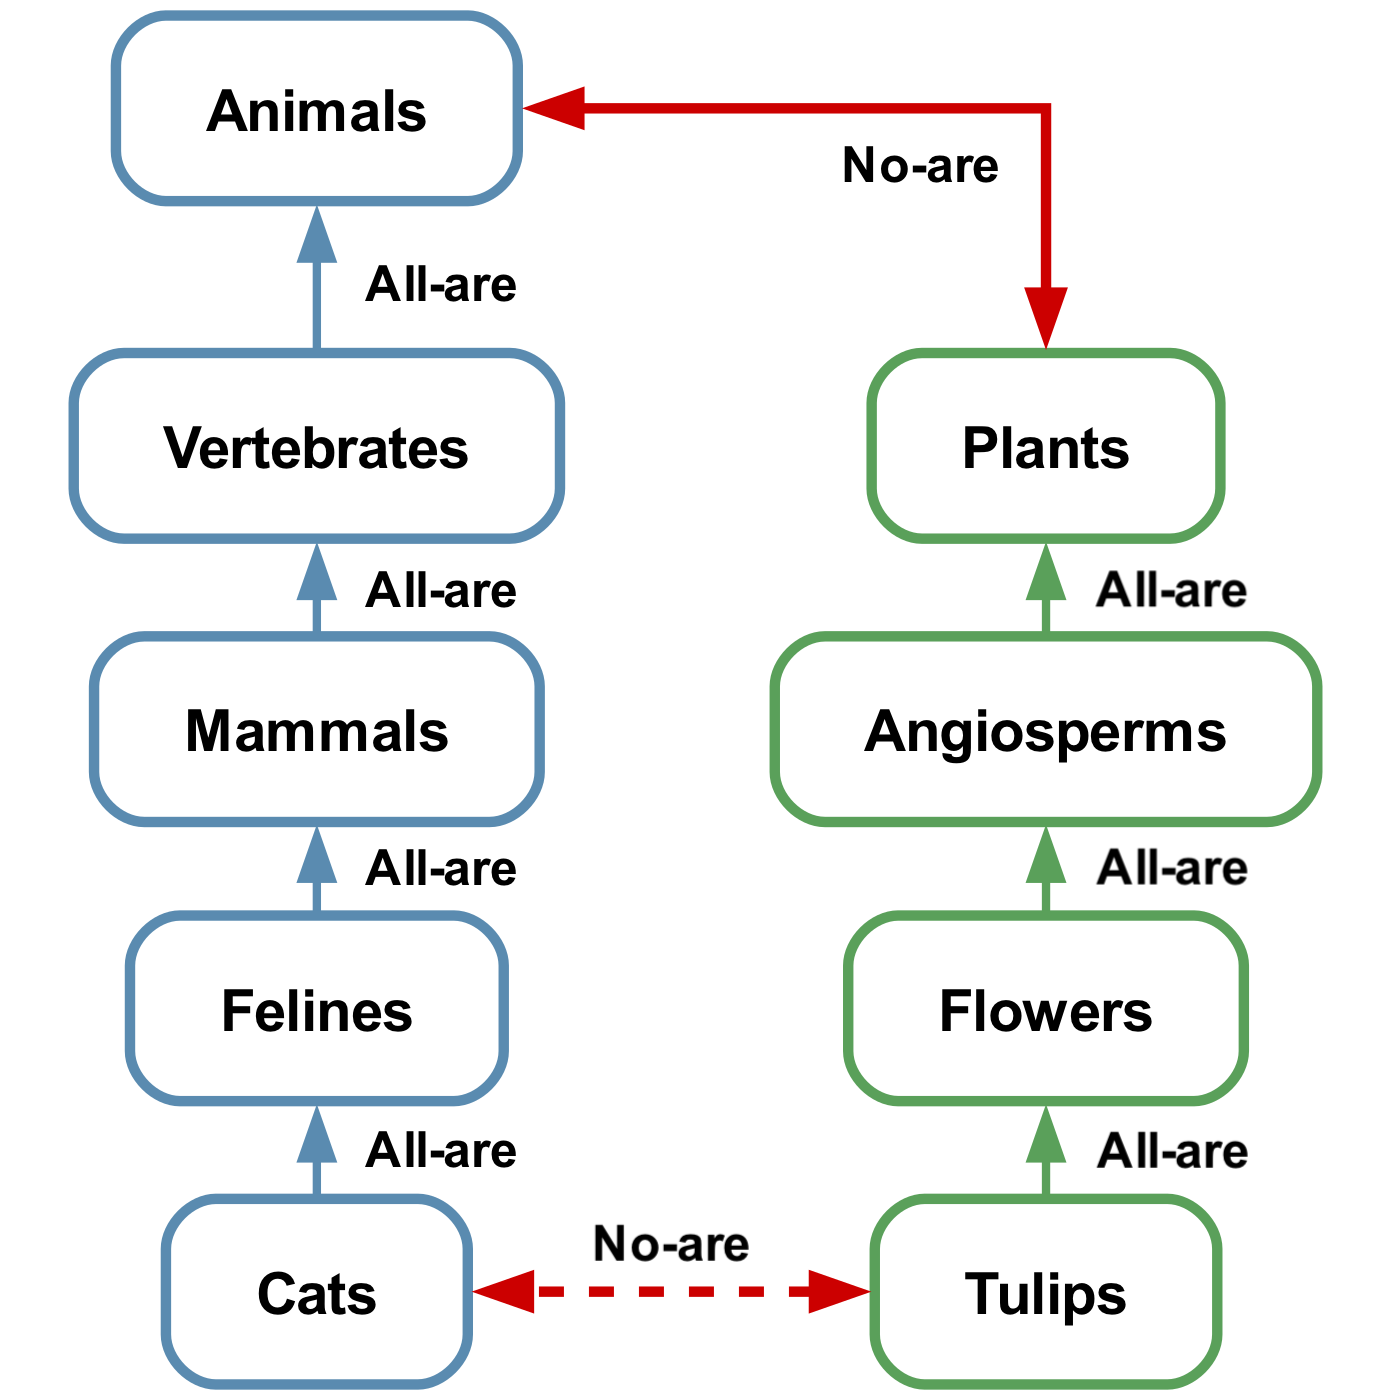
The image is a **hierarchical flowchart** with two primary branches (Animals and Plants) and a cross-link between subcategories. It uses **color-coded arrows** to denote relationships ("All-are" and "No-are") and **boxed categories** to represent taxonomic classifications.
---
## Key Components
### 1. **Legend & Color Coding**
- **Blue**: Represents the "Animals" branch and its subcategories.
- **Green**: Represents the "Plants" branch and its subcategories.
- **Red Dashed Arrows**: Denote exclusion ("No-are") relationships.
- **Arrow Labels**:
- `All-are`: Indicates hierarchical inclusion (e.g., "Cats are Felines").
- `No-are`: Indicates exclusion (e.g., "Cats are not Tulips").
---
### 2. **Animals Branch (Blue)**
#### Structure:
1. **Animals** → `All-are` → **Vertebrates**
2. **Vertebrates** → `All-are` → **Mammals**
3. **Mammals** → `All-are` → **Felines**
4. **Felines** → `All-are` → **Cats**
#### Spatial Grounding:
- All boxes are connected vertically with **solid blue arrows**.
- Labels are positioned **above** arrows (e.g., "All-are" above the arrow from "Animals" to "Vertebrates").
---
### 3. **Plants Branch (Green)**
#### Structure:
1. **Plants** → `All-are` → **Angiosperms**
2. **Angiosperms** → `All-are` → **Flowers**
3. **Flowers** → `All-are` → **Tulips**
#### Spatial Grounding:
- All boxes are connected vertically with **solid green arrows**.
- Labels are positioned **above** arrows (e.g., "All-are" above the arrow from "Plants" to "Angiosperms").
---
### 4. **Cross-Link: "No-are" Relationship**
- A **red dashed arrow** connects **Cats** (blue branch) to **Tulips** (green branch).
- Label: `No-are` (indicating "Cats are not Tulips").
---
## Diagram Flow
1. **Top-Level Categories**:
- **Animals** (blue) and **Plants** (green) are the root nodes.
2. **Hierarchical Descent**:
- Each branch descends through increasingly specific subcategories (e.g., Vertebrates → Mammals → Felines → Cats).
3. **Exclusion**:
- The red dashed arrow creates a direct contradiction between the terminal nodes of both branches.
---
## Key Trends & Data Points
- **Taxonomic Hierarchy**: Both branches follow a strict "All-are" inclusion logic, reflecting biological classification (e.g., Cats ⊆ Felines ⊆ Mammals ⊆ Vertebrates ⊆ Animals).
- **Contradiction**: The "No-are" relationship between Cats and Tulips highlights categorical incompatibility (animal vs. plant).
---
## Notes
- **No Numerical Data**: The diagram is purely categorical, with no quantitative values or trends.
- **Language**: All text is in English. No other languages are present.
---
## Final Output
The flowchart visually encodes taxonomic relationships using color-coded arrows and hierarchical boxes. It emphasizes inclusion ("All-are") within branches and exclusion ("No-are") between terminal nodes of opposing branches.