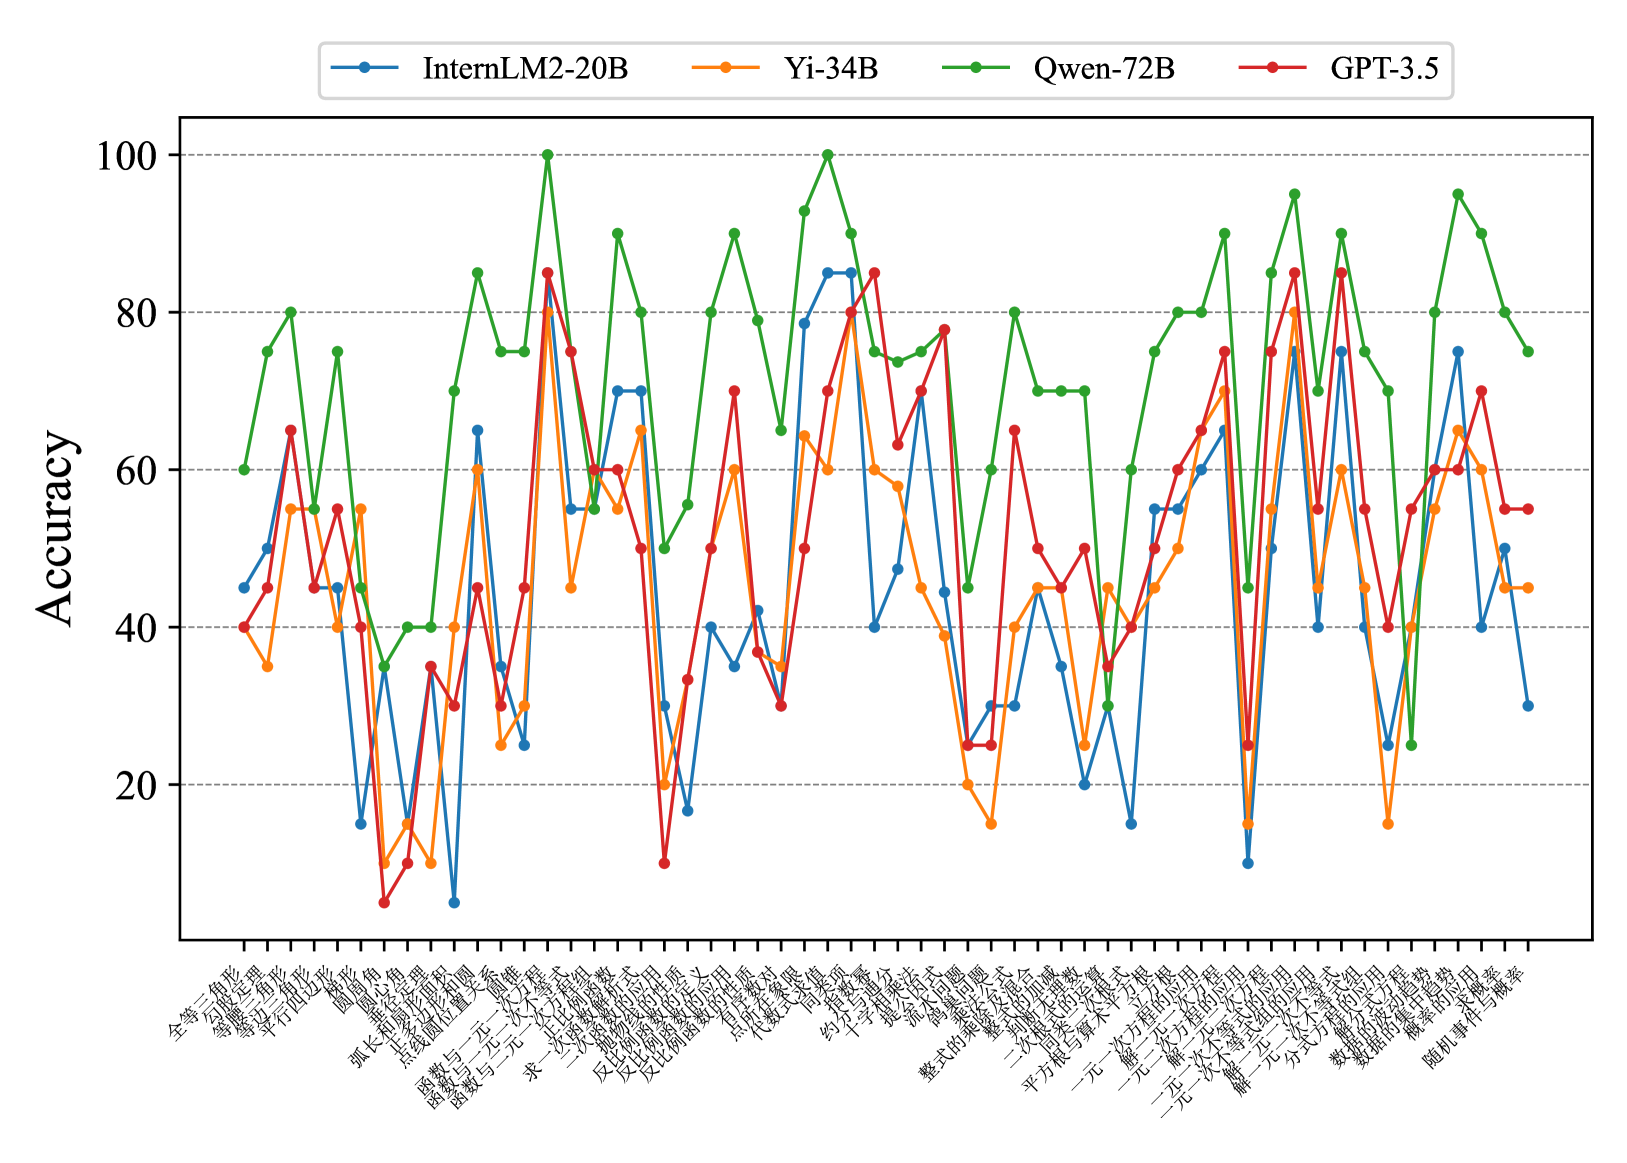
## Line Chart: Accuracy Comparison of Language Models
### Overview
This line chart compares the accuracy of four language models – InternLM2-20B, Yi-34B, Qwen-72B, and GPT-3.5 – across a series of 35 different tasks or datasets. The y-axis represents accuracy, ranging from 0 to 100, while the x-axis lists the tasks in Chinese characters.
### Components/Axes
* **Y-axis:** "Accuracy" (labeled on the left side, scale from 0 to 100, increments of 10).
* **X-axis:** A series of 35 tasks/datasets labeled in Chinese characters. The labels are densely packed along the bottom of the chart.
* **Legend:** Located at the top-right of the chart, identifying each line with a color and model name:
* Blue: InternLM2-20B
* Yellow: Yi-34B
* Green: Qwen-72B
* Red: GPT-3.5
### Detailed Analysis
The chart displays accuracy as a function of the task. Each line represents a language model's performance across the 35 tasks. I will describe the trends and extract approximate data points for each model.
**InternLM2-20B (Blue Line):** This line exhibits significant fluctuations. It starts at approximately 60, dips to around 10, then rises to a peak of approximately 90 before declining again. The line generally oscillates between 30 and 80.
* Task 1: ~60
* Task 5: ~10
* Task 10: ~40
* Task 15: ~70
* Task 20: ~85
* Task 25: ~60
* Task 30: ~30
* Task 35: ~30
**Yi-34B (Yellow Line):** This line shows a more moderate range of variation. It begins around 40, dips to approximately 20, and reaches a peak of around 85. It generally stays between 30 and 80.
* Task 1: ~40
* Task 5: ~20
* Task 10: ~50
* Task 15: ~65
* Task 20: ~85
* Task 25: ~70
* Task 30: ~40
* Task 35: ~50
**Qwen-72B (Green Line):** This line demonstrates the highest overall accuracy and the most pronounced peaks. It starts around 50, rises to a maximum of approximately 95, and dips to around 30. It generally stays between 40 and 90.
* Task 1: ~50
* Task 5: ~60
* Task 10: ~80
* Task 15: ~90
* Task 20: ~95
* Task 25: ~80
* Task 30: ~60
* Task 35: ~30
**GPT-3.5 (Red Line):** This line exhibits a relatively stable performance, generally staying between 40 and 60. It starts around 45, dips to approximately 25, and reaches a peak of around 65.
* Task 1: ~45
* Task 5: ~25
* Task 10: ~40
* Task 15: ~55
* Task 20: ~65
* Task 25: ~50
* Task 30: ~45
* Task 35: ~55
### Key Observations
* Qwen-72B consistently outperforms the other models, achieving the highest accuracy across most tasks.
* InternLM2-20B shows the most variability in performance, with large swings in accuracy.
* GPT-3.5 exhibits the most stable, but also the lowest, performance.
* Yi-34B falls between InternLM2-20B and Qwen-72B in terms of both average accuracy and variability.
* There are several tasks where all models perform poorly (accuracy below 30).
### Interpretation
The chart suggests that Qwen-72B is the most capable language model among those tested, demonstrating superior performance across a diverse set of tasks. The significant fluctuations in InternLM2-20B's accuracy may indicate sensitivity to specific task characteristics or data distributions. GPT-3.5's stable but lower performance suggests it may be more robust but less adaptable than the other models. The tasks where all models struggle could represent particularly challenging areas for current language models, or areas where the evaluation metrics are not well-aligned with model capabilities. The Chinese labels on the x-axis indicate that the tasks are likely related to Chinese language processing, such as text classification, question answering, or machine translation. Further investigation would be needed to understand the specific nature of each task and the reasons for the observed performance differences. The data suggests a clear hierarchy of performance, with Qwen-72B leading, followed by Yi-34B, then InternLM2-20B, and finally GPT-3.5.