# Technical Document Extraction: Normalized Speedup Analysis
## Chart Overview
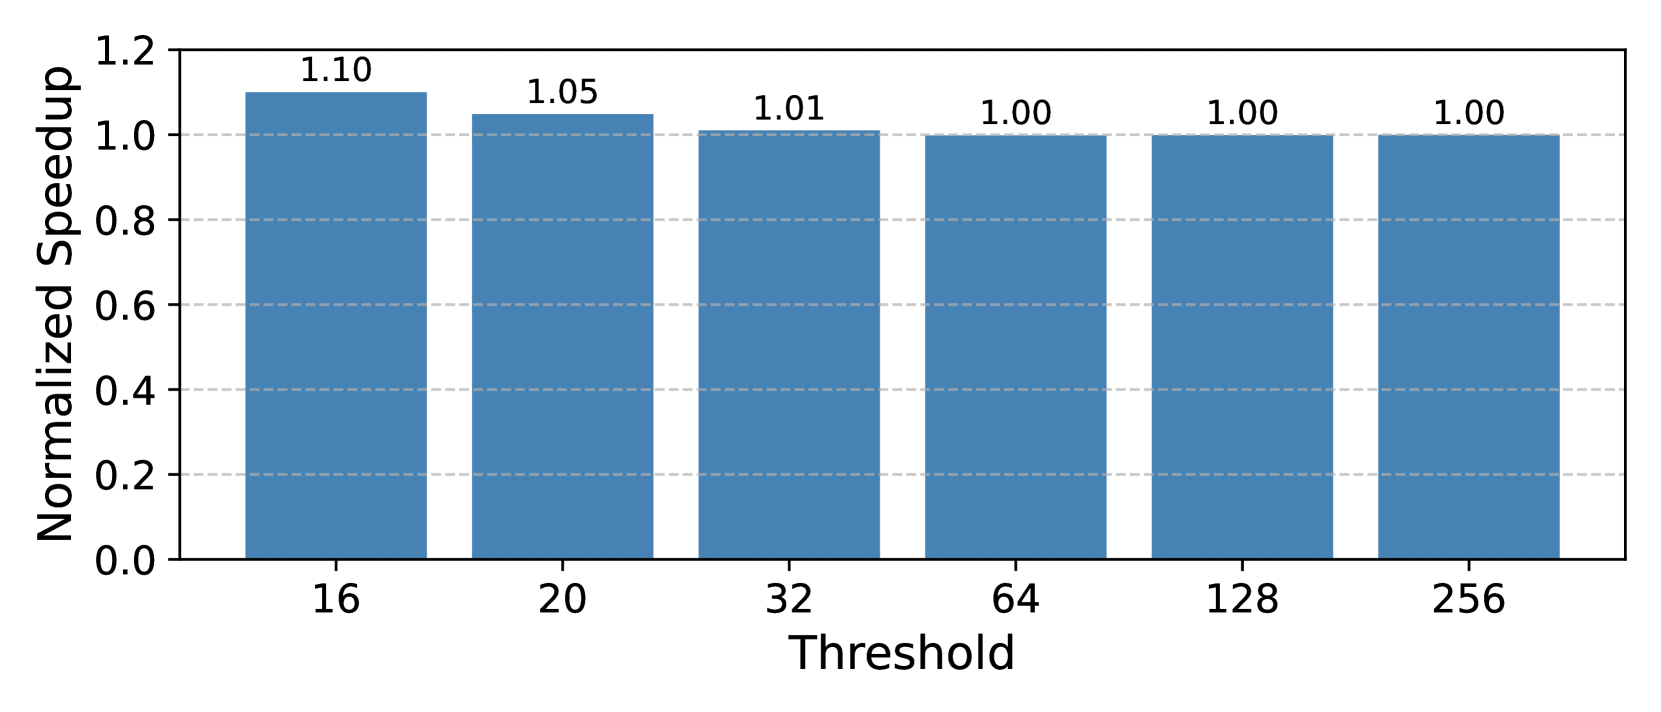
- **Type**: Bar Chart
- **Title**: Normalized Speedup
- **Background**: White
- **Grid**: Dashed gray lines
## Axes
- **X-Axis (Horizontal)**:
- Label: Threshold
- Categories: 16, 20, 32, 64, 128, 256
- Tick Marks: Aligned with bar centers
- **Y-Axis (Vertical)**:
- Label: Normalized Speedup
- Range: 0.0 to 1.2
- Increment: 0.2
- Tick Marks: Dashed lines
## Data Points
| Threshold | Normalized Speedup |
|-----------|--------------------|
| 16 | 1.10 |
| 20 | 1.05 |
| 32 | 1.01 |
| 64 | 1.00 |
| 128 | 1.00 |
| 256 | 1.00 |
## Visual Trends
- **Bar Heights**:
- Decreasing trend from left to right (1.10 → 1.00).
- Stabilizes at 1.00 for thresholds ≥ 64.
- **Color**: All bars are blue (no legend present).
## Spatial Grounding
- **Legend**: Not applicable (no legend in the chart).
- **Bar Placement**:
- X-axis: Centered under each threshold label.
- Y-axis: Aligned with speedup values.
## Component Isolation
1. **Header**: Chart title ("Normalized Speedup") at the top.
2. **Main Chart**:
- Bars with labeled values.
- Axes with gridlines.
3. **Footer**: No additional text or elements.
## Notes
- No textual blocks, tables, or non-English content present.
- All data points are explicitly labeled on the bars.
- No missing or inferred values; all information is directly extracted from the chart.