## 3D Surface Plot: Minimised Energy vs. θ1 and θ2
### Overview
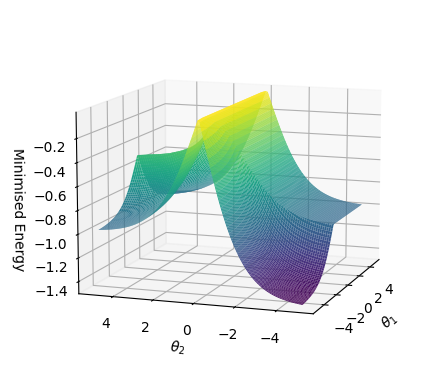
The image is a 3D surface plot visualizing the relationship between "Minimised Energy" and two variables, θ1 and θ2. The surface is colored to represent the energy level, with lower energy values appearing in purple/blue and higher energy values in yellow/green.
### Components/Axes
* **X-axis:** θ1, ranging from approximately -5 to 5.
* **Y-axis:** θ2, ranging from approximately -5 to 5.
* **Z-axis:** Minimised Energy, ranging from -1.4 to -0.2.
### Detailed Analysis
The surface plot shows how the minimized energy changes as θ1 and θ2 vary.
* **Trend along θ1:** The energy appears to be at a minimum when θ1 is around -4 to -5, rising sharply to a peak around θ1 = 0, and then decreasing again as θ1 increases.
* **Trend along θ2:** The energy appears to be at a minimum when θ2 is around -4 to -5, rising sharply to a peak around θ2 = 0, and then decreasing again as θ2 increases.
* **Specific Values:**
* The minimum energy value is approximately -1.4, occurring when both θ1 and θ2 are around -5.
* The maximum energy value is approximately -0.2, occurring when both θ1 and θ2 are around 0.
* When θ1 is 0 and θ2 is 5, the energy is approximately -0.8.
* When θ1 is 5 and θ2 is 0, the energy is approximately -0.8.
### Key Observations
* The surface has a saddle-like shape, with a minimum in the bottom-left corner and a peak in the center.
* The energy surface is relatively flat when θ1 and θ2 are both large and negative.
* The energy surface rises sharply as either θ1 or θ2 approaches zero.
### Interpretation
The plot visualizes an energy landscape where the goal is to find the minimum energy configuration. The variables θ1 and θ2 likely represent parameters that influence the energy of a system. The plot suggests that the system's energy is minimized when both parameters are at their lowest values (around -5). The peak in the center indicates an unstable or high-energy configuration. The saddle shape suggests that there might be multiple local minima, but the global minimum is located in the bottom-left corner of the plot.