\n
## 3D Surface Plot: Minimised Energy Landscape
### Overview
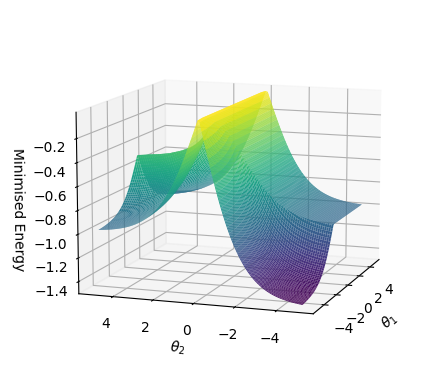
The image depicts a 3D surface plot representing a minimised energy landscape. The plot visualizes the relationship between two angular parameters, θ₁ and θ₂, and the resulting minimised energy. The surface is colored to indicate energy levels, with warmer colors (yellow/green) representing higher energy and cooler colors (blue/purple) representing lower energy.
### Components/Axes
* **X-axis:** θ₂ (Theta 2), ranging approximately from -4 to 4.
* **Y-axis:** θ₁ (Theta 1), ranging approximately from -4 to 4.
* **Z-axis:** Minimised Energy, ranging approximately from -0.2 to -1.4.
* **Surface:** Represents the minimised energy as a function of θ₁ and θ₂.
* **Color Gradient:** A continuous color gradient is used to represent energy levels. The gradient appears to transition from purple (lowest energy) to blue, green, and finally yellow (highest energy).
### Detailed Analysis
The surface exhibits a complex shape with two distinct minima.
* **Minimum 1:** Located approximately at θ₁ = 2, θ₂ = 0. The energy at this minimum is around -0.2.
* **Minimum 2:** Located approximately at θ₁ = -2, θ₂ = 0. The energy at this minimum is also around -0.2.
* **Saddle Point:** A saddle point is visible between the two minima, around θ₁ = 0, θ₂ = 0. The energy at this point is approximately -0.6.
* **Energy Increase:** The energy increases as θ₁ and θ₂ move away from the minima, forming two "valleys" separated by a "ridge".
* **Surface Slope:** The surface slopes steeply downwards towards the minima from all directions.
* **Maximum Energy:** The maximum energy appears to be around -0.2, located at the peaks of the surface.
* **Minimum Energy:** The minimum energy appears to be around -1.4, located at the bottom of the valleys.
### Key Observations
* The energy landscape has two equivalent minima, suggesting two stable states or configurations.
* The symmetry of the landscape around the θ₂ = 0 axis indicates that the system is invariant under reflection across this axis.
* The saddle point represents an unstable equilibrium.
* The energy landscape is relatively smooth, with no sharp discontinuities.
### Interpretation
This plot likely represents the potential energy surface of a physical system with two degrees of freedom (θ₁ and θ₂). The minima correspond to stable states of the system, where the energy is minimized. The saddle point represents an unstable state, where the system can transition between the two minima. The shape of the energy landscape dictates the dynamics of the system, influencing how it evolves over time. The two minima suggest that the system can exist in two distinct configurations with equal energy. This could represent a system with a symmetry, or a system that can switch between two states. The plot suggests that the system will tend to settle into one of the two minima, but it could also overcome the energy barrier at the saddle point and transition between the two states. The exact nature of the system and the meaning of θ₁ and θ₂ would depend on the specific context of the problem.