## 3D Surface Plot: Minimised Energy vs. θ₁ and θ₂
### Overview
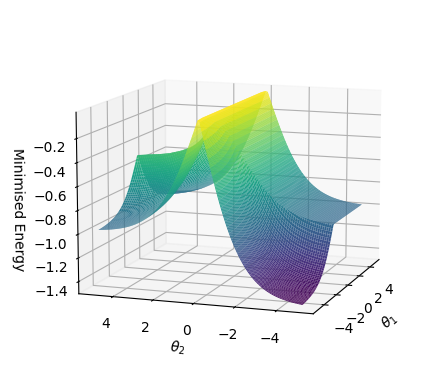
The image displays a three-dimensional surface plot visualizing the relationship between two independent variables, θ₁ and θ₂, and a dependent variable labeled "Minimised Energy." The plot uses a color gradient to represent the energy value at each coordinate pair.
### Components/Axes
* **Vertical Axis (Z-axis):** Labeled "Minimised Energy." The scale runs from approximately -1.4 at the bottom to -0.2 at the top, with major tick marks at intervals of 0.2 (-1.4, -1.2, -1.0, -0.8, -0.6, -0.4, -0.2).
* **Horizontal Axis 1 (X-axis, front-left):** Labeled "θ₂". The scale runs from -4 to 4, with major tick marks at -4, -2, 0, 2, 4.
* **Horizontal Axis 2 (Y-axis, front-right):** Labeled "θ₁". The scale runs from -4 to 4, with major tick marks at -4, -2, 0, 2, 4.
* **Color Mapping:** The surface color corresponds to the "Minimised Energy" value. A gradient is used where:
* **Yellow/Light Green:** Represents higher energy values (closer to -0.2).
* **Teal/Green:** Represents mid-range energy values (around -0.6 to -0.8).
* **Blue/Purple:** Represents lower energy values (closer to -1.4).
### Detailed Analysis
The surface exhibits a complex, non-linear topology with distinct features:
1. **Primary Peak (Global Maximum):** A prominent, sharp peak is located near the center of the θ₁-θ₂ plane, approximately at coordinates (θ₁ ≈ 0, θ₂ ≈ 0). This peak is colored bright yellow, indicating the highest "Minimised Energy" value on the plot, estimated to be between -0.2 and -0.3.
2. **Secondary Ridge:** A lower, elongated ridge extends from the primary peak along the positive θ₂ direction (towards θ₂ = 4). This ridge is colored light green/yellow-green, suggesting energy values in the range of -0.4 to -0.5.
3. **Deep Valley (Global Minimum):** A significant depression or valley is located in the quadrant where both θ₁ and θ₂ are negative. The lowest point appears near (θ₁ ≈ -2, θ₂ ≈ -2). This area is deep purple, corresponding to the lowest energy values, estimated between -1.3 and -1.4.
4. **General Trend:** The surface generally slopes downward from the central peak towards the corners of the plotted domain, particularly towards the (-θ₁, -θ₂) quadrant. The gradient is steepest descending from the peak into the deep valley.
### Key Observations
* The relationship between the parameters (θ₁, θ₂) and the "Minimised Energy" is highly non-convex, featuring multiple local minima and maxima.
* The global minimum energy state is not at the origin (0,0) but is offset into the negative parameter space.
* The surface is symmetric about the θ₂ axis to a degree, but not perfectly symmetric about the θ₁ axis, as the deep valley is more pronounced on the negative θ₁ side.
* The color gradient provides a clear visual cue for the energy landscape, making the peaks and valleys immediately identifiable.
### Interpretation
This plot likely represents the energy landscape of a system governed by two parameters, θ₁ and θ₂. In contexts like optimization, machine learning, or physics, such a landscape shows how a cost or energy function varies with changes in its inputs.
* **What it demonstrates:** The system has a complex optimization surface. Finding the global minimum (the deepest purple valley) would be the goal of an optimization algorithm. The presence of a high central peak and other ridges indicates that simple gradient-based methods could easily get stuck in local minima if not properly initialized or designed.
* **Relationship between elements:** The θ₁ and θ₂ parameters jointly determine the system's energy. Their interaction is non-linear, as evidenced by the curved, saddle-like shapes. The "Minimised Energy" is the output metric being minimized or analyzed.
* **Notable anomalies:** The sharp, isolated nature of the central peak is notable. It suggests a specific, unstable configuration of parameters (θ₁≈0, θ₂≈0) that results in a high-energy state, surrounded by more stable, lower-energy configurations. The deep, localized valley indicates a very specific, favorable parameter combination for minimizing energy.
**Language Note:** All text in the image is in English.