## 3D Surface Plots: Performance Analysis of Backdoor and Targeted Attacks
### Overview
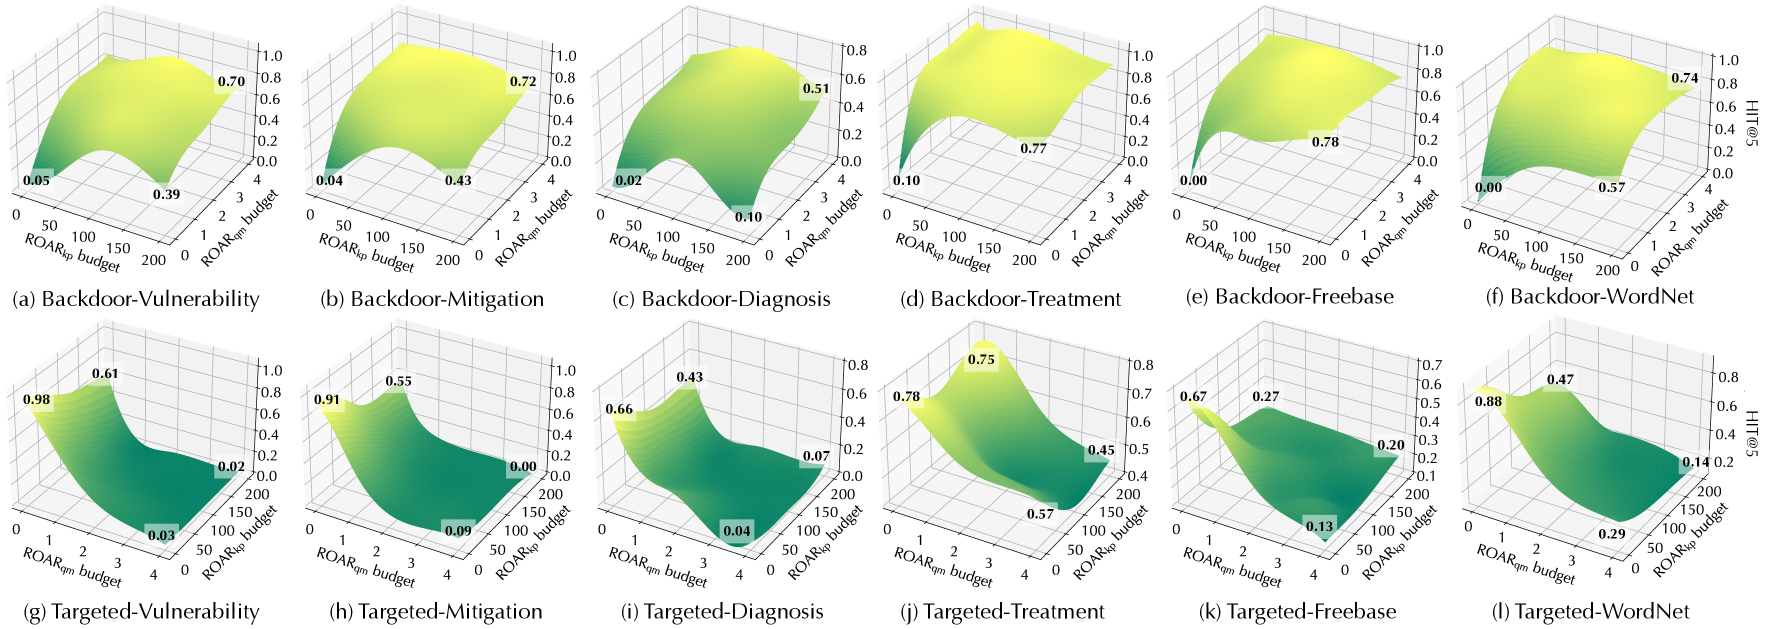
This image presents a grid of 12 3D surface plots, organized into two rows and six columns. The plots visualize the relationship between two independent variables—$ROAR_{qm}$ budget and $ROAR_{kp}$ budget—and a dependent variable, HIT@5. The top row (a-f) represents "Backdoor" scenarios, while the bottom row (g-l) represents "Targeted" scenarios. The plots demonstrate how the HIT@5 metric changes as the budgets for $ROAR_{qm}$ and $ROAR_{kp}$ are adjusted.
### Components/Axes
* **Grid Layout:**
* **Top Row (a-f):** Backdoor-Vulnerability, Backdoor-Mitigation, Backdoor-Diagnosis, Backdoor-Treatment, Backdoor-Freebase, Backdoor-WordNet.
* **Bottom Row (g-l):** Targeted-Vulnerability, Targeted-Mitigation, Targeted-Diagnosis, Targeted-Treatment, Targeted-Freebase, Targeted-WordNet.
* **Axes (Common to all plots):**
* **X-axis ($ROAR_{qm}$ budget):** Ranges from 0 to 4.
* **Y-axis ($ROAR_{kp}$ budget):** Ranges from 0 to 200.
* **Z-axis (Vertical):** HIT@5, ranging from 0.0 to 1.0 (scales vary slightly by plot).
* **Visual Encoding:**
* **Color:** A gradient from dark green (low values) to yellow (high values).
* **Annotations:** Specific numerical values are provided at the corners of the surfaces to indicate approximate HIT@5 values at those coordinates.
---
### Detailed Analysis
#### Top Row: Backdoor Scenarios
*General Trend:* All Backdoor plots exhibit an upward trend, where HIT@5 values increase as both $ROAR_{qm}$ and $ROAR_{kp}$ budgets increase. The surfaces generally slope from the origin (low) to the far corner (high).
* **(a) Backdoor-Vulnerability:** Starts at ~0.05 (0,0). Rises to ~0.39 at (4,0) and ~0.70 at (4,200).
* **(b) Backdoor-Mitigation:** Starts at ~0.04 (0,0). Rises to ~0.43 at (4,0) and ~0.72 at (4,200).
* **(c) Backdoor-Diagnosis:** Starts at ~0.02 (0,0). Rises to ~0.10 at (4,0) and ~0.51 at (4,200).
* **(d) Backdoor-Treatment:** Starts at ~0.10 (0,0). Rises sharply to ~0.77 at (4,200).
* **(e) Backdoor-Freebase:** Starts at ~0.00 (0,0). Rises sharply to ~0.78 at (4,200).
* **(f) Backdoor-WordNet:** Starts at ~0.00 (0,0). Rises to ~0.57 at (4,0) and ~0.74 at (4,200).
#### Bottom Row: Targeted Scenarios
*General Trend:* All Targeted plots exhibit a downward trend, where HIT@5 values are highest at the origin (0,0) and decrease significantly as budgets increase.
* **(g) Targeted-Vulnerability:** Starts high at ~0.98 (0,0). Drops to ~0.03 at (4,0) and ~0.02 at (4,200). The value at (0,200) is ~0.61.
* **(h) Targeted-Mitigation:** Starts high at ~0.91 (0,0). Drops to ~0.09 at (4,0) and ~0.00 at (4,200). The value at (0,200) is ~0.55.
* **(i) Targeted-Diagnosis:** Starts at ~0.66 (0,0). Drops to ~0.04 at (4,0) and ~0.07 at (4,200). The value at (0,200) is ~0.43.
* **(j) Targeted-Treatment:** Starts at ~0.78 (0,0). Drops to ~0.57 at (4,0) and ~0.45 at (4,200). The value at (0,200) is ~0.75.
* **(k) Targeted-Freebase:** Starts at ~0.67 (0,0). Drops to ~0.13 at (4,0) and ~0.20 at (4,200). The value at (0,200) is ~0.27.
* **(l) Targeted-WordNet:** Starts at ~0.88 (0,0). Drops to ~0.29 at (4,0) and ~0.14 at (4,200). The value at (0,200) is ~0.47.
---
### Key Observations
1. **Inverse Relationship:** The most significant observation is the complete inversion of the surface topography between the Backdoor and Targeted categories. Backdoor performance improves with budget, while Targeted performance degrades with budget.
2. **Sensitivity:** Targeted attacks show high sensitivity to budget increases, with performance often dropping near zero at maximum budget levels (e.g., plots g, h, i).
3. **Consistency:** The behavior is remarkably consistent across the different datasets (Vulnerability, Mitigation, Diagnosis, Treatment, Freebase, WordNet), suggesting that the observed trends are fundamental to the attack types rather than dataset-specific anomalies.
### Interpretation
The data suggests a fundamental divergence in how "Backdoor" and "Targeted" attacks respond to the ROAR budget parameters.
* **Backdoor Attacks:** The positive correlation between budget and HIT@5 suggests that increasing the budget (likely representing the removal or retraining process) actually *increases* the HIT@5 metric. This could imply that the "budget" is not effectively mitigating the backdoor, or that the metric is measuring the success rate of the backdoor itself, which becomes more pronounced or easier to trigger as the model is modified.
* **Targeted Attacks:** The negative correlation suggests that the budget is highly effective at mitigating these attacks. As the budget increases, the HIT@5 (likely representing model accuracy or attack success) drops precipitously.
* **Peircean Investigative Note:** The visual symmetry between the two rows is striking. The "Targeted" plots resemble a "cliff" where performance falls off as resources are applied, whereas the "Backdoor" plots resemble a "ramp" where performance climbs. This implies that the ROAR mechanism acts as a robust defense against Targeted attacks but fails to suppress (or perhaps inadvertently amplifies) Backdoor attacks.