## Heatmaps: Backdoor Attack Performance vs. Budget
### Overview
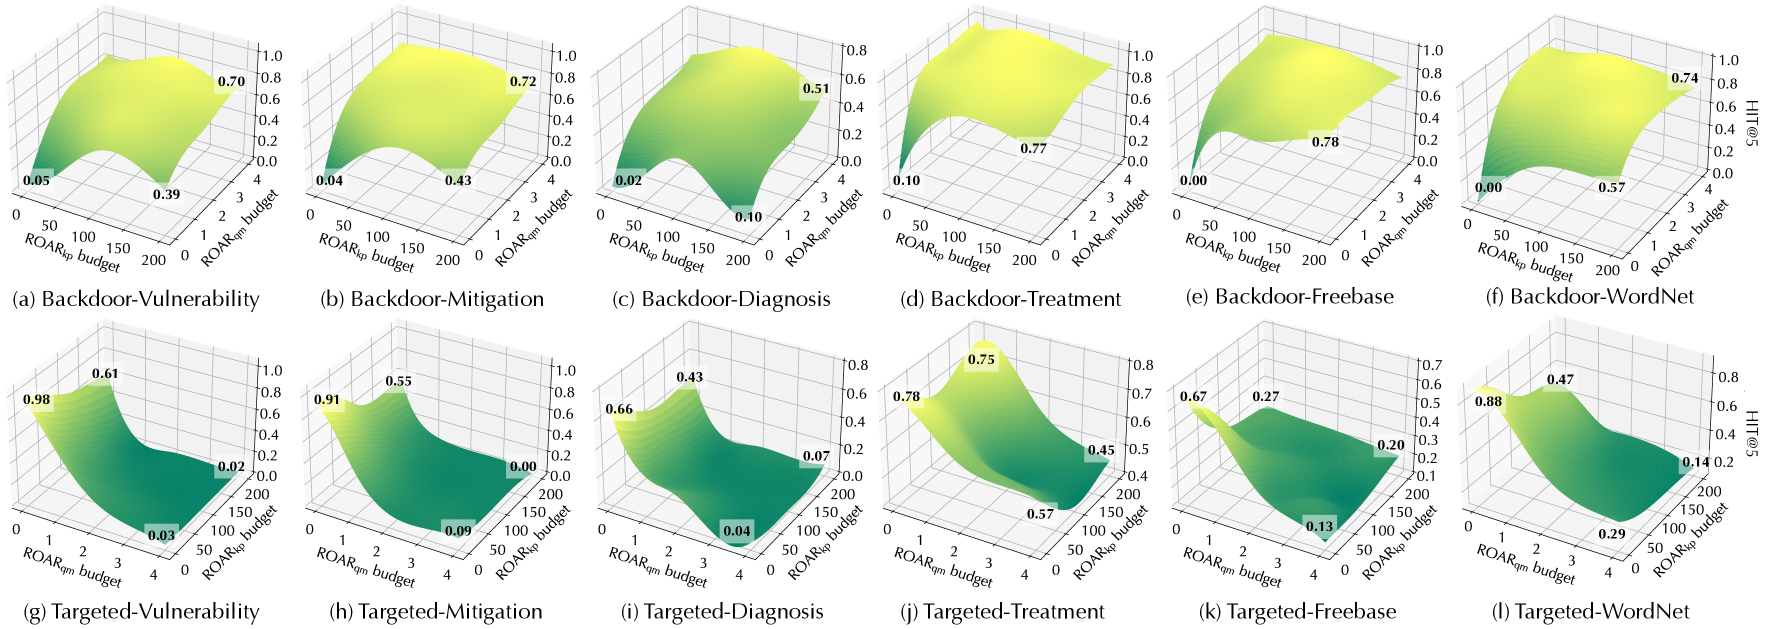
The image presents a 2x5 grid of heatmaps, each representing the performance of a backdoor attack under different conditions. The heatmaps visualize the relationship between "ROAR@ budget" (x-axis) and "HIT@5" (y-axis), with color intensity indicating performance. Each heatmap corresponds to a specific attack scenario: Vulnerability, Mitigation, Diagnosis, Treatment, Freebase, WordNet, Dependency, Targeted-Mitigation, Targeted-Treatment, and Targeted-Freebase.
### Components/Axes
* **X-axis:** ROAR@ budget, ranging from 0 to 4, with markers at 50, 100, 150, 200. The label is "ROAR@ budget".
* **Y-axis:** HIT@5, ranging from 0.0 to 1.1, with markers at 0.2, 0.4, 0.6, 0.8, 1.0. The label is "HIT@5".
* **Color Scale:** Represents performance, with darker shades indicating higher values. The scale ranges from approximately 0.0 to 1.0.
* **Labels:** Each heatmap is labeled with a letter (a-j) and a descriptive title indicating the attack scenario.
* **Grid Layout:** 2 rows and 5 columns of heatmaps.
### Detailed Analysis or Content Details
**a) Backdoor-Vulnerability:**
* Trend: The heatmap shows an upward sloping trend, with performance increasing as both ROAR@ budget and HIT@5 increase.
* Data Points (approximate):
* ROAR@ budget = 0, HIT@5 = 0: ~0.05
* ROAR@ budget = 4, HIT@5 = 1.1: ~0.70
* ROAR@ budget = 200, HIT@5 = 0.8: ~0.39
**b) Backdoor-Mitigation:**
* Trend: Similar to (a), an upward sloping trend is observed.
* Data Points (approximate):
* ROAR@ budget = 0, HIT@5 = 0: ~0.04
* ROAR@ budget = 4, HIT@5 = 1.1: ~0.72
* ROAR@ budget = 200, HIT@5 = 0.8: ~0.43
**c) Backdoor-Diagnosis:**
* Trend: Performance is generally low, with a slight upward trend.
* Data Points (approximate):
* ROAR@ budget = 0, HIT@5 = 0: ~0.07
* ROAR@ budget = 4, HIT@5 = 1.1: ~0.51
* ROAR@ budget = 200, HIT@5 = 0.8: ~0.10
**d) Backdoor-Treatment:**
* Trend: Moderate upward trend.
* Data Points (approximate):
* ROAR@ budget = 0, HIT@5 = 0: ~0.10
* ROAR@ budget = 4, HIT@5 = 1.1: ~0.77
* ROAR@ budget = 200, HIT@5 = 0.8: ~0.27
**e) Backdoor-Freebase:**
* Trend: Moderate upward trend.
* Data Points (approximate):
* ROAR@ budget = 0, HIT@5 = 0: ~0.00
* ROAR@ budget = 4, HIT@5 = 1.1: ~0.78
* ROAR@ budget = 200, HIT@5 = 0.8: ~0.57
**f) Backdoor-WordNet:**
* Trend: Moderate upward trend.
* Data Points (approximate):
* ROAR@ budget = 0, HIT@5 = 0: ~0.00
* ROAR@ budget = 4, HIT@5 = 1.1: ~0.47
* ROAR@ budget = 200, HIT@5 = 0.8: ~0.88
**g) Backdoor-Dependency:**
* Trend: Moderate upward trend.
* Data Points (approximate):
* ROAR@ budget = 0, HIT@5 = 0: ~0.02
* ROAR@ budget = 4, HIT@5 = 1.1: ~0.61
* ROAR@ budget = 200, HIT@5 = 0.8: ~0.10
**h) Targeted-Mitigation:**
* Trend: Moderate upward trend.
* Data Points (approximate):
* ROAR@ budget = 0, HIT@5 = 0: ~0.00
* ROAR@ budget = 4, HIT@5 = 1.1: ~0.53
* ROAR@ budget = 200, HIT@5 = 0.8: ~0.91
**i) Targeted-Treatment:**
* Trend: Moderate upward trend.
* Data Points (approximate):
* ROAR@ budget = 0, HIT@5 = 0: ~0.02
* ROAR@ budget = 4, HIT@5 = 1.1: ~0.75
* ROAR@ budget = 200, HIT@5 = 0.8: ~0.45
**j) Targeted-Freebase:**
* Trend: Moderate upward trend.
* Data Points (approximate):
* ROAR@ budget = 0, HIT@5 = 0: ~0.03
* ROAR@ budget = 4, HIT@5 = 1.1: ~0.27
* ROAR@ budget = 200, HIT@5 = 0.8: ~0.88
### Key Observations
* Generally, increasing the ROAR@ budget leads to improved HIT@5 performance across all attack scenarios.
* "Backdoor-Diagnosis" consistently shows the lowest performance compared to other scenarios.
* "Targeted-Mitigation" shows a relatively high performance, especially at higher ROAR@ budgets.
* The heatmaps for "Backdoor-Vulnerability" and "Backdoor-Mitigation" exhibit similar performance patterns.
### Interpretation
The data suggests that increasing the ROAR@ budget can effectively improve the success rate (HIT@5) of backdoor attacks. However, the effectiveness varies significantly depending on the specific attack scenario. The "Backdoor-Diagnosis" scenario consistently performs poorly, indicating that diagnosing backdoor attacks is more challenging than launching or mitigating them. The targeted attacks ("Targeted-Mitigation", "Targeted-Treatment", "Targeted-Freebase") demonstrate varying degrees of success, with "Targeted-Mitigation" showing particularly strong performance. This could indicate that mitigation strategies are more effective when specifically targeted. The heatmaps provide a visual representation of the trade-off between resource allocation (ROAR@ budget) and attack success, offering insights into the effectiveness of different attack and defense strategies. The consistent upward trend across most scenarios highlights the importance of resource investment in both attack and defense mechanisms.