## 3D Surface Plots: Backdoor and Targeted Attack Metrics vs. ROAR Budgets
### Overview
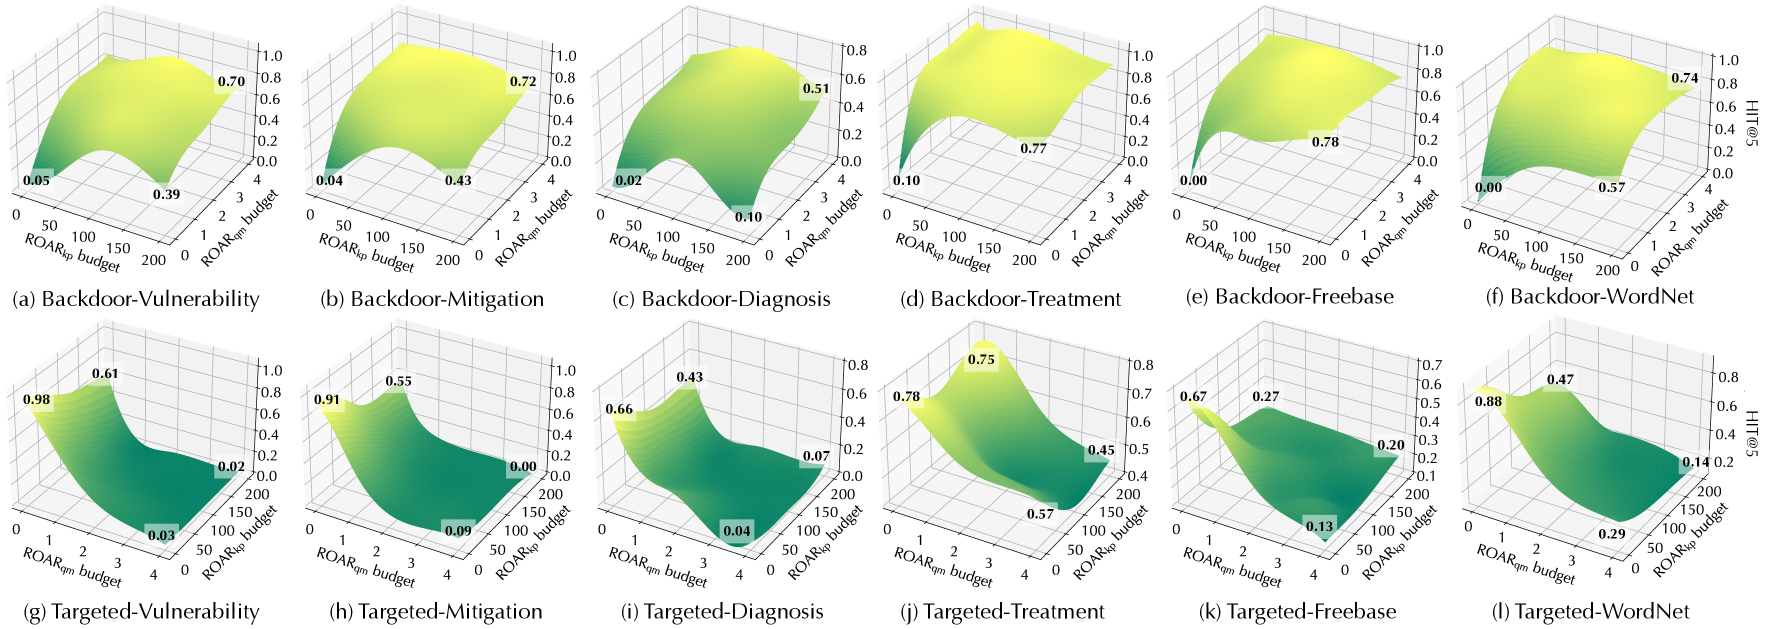
The image contains 12 3D surface plots (2 rows × 6 columns) illustrating the relationship between two budget parameters (**ROAR_sp budget** (x-axis, 0–200) and **ROAR_qm budget** (y-axis, 0–4)) and a performance/vulnerability metric (z-axis, typically 0–1, with some plots capped at 0.8). Plots are grouped into *Backdoor* (top row, (a)–(f)) and *Targeted* (bottom row, (g)–(l)) attack scenarios, with subcategories (Vulnerability, Mitigation, Diagnosis, Treatment, Freebase, WordNet).
### Components/Axes
- **X-axis (ROAR_sp budget)**: Range 0–200 (increments of 50: 0, 50, 100, 150, 200).
- **Y-axis (ROAR_qm budget)**: Range 0–4 (increments of 1: 0, 1, 2, 3, 4).
- **Z-axis (Metric)**: Typically 0–1 (e.g., (a), (b), (d), (e), (f), (g), (h), (j), (l)), with some plots (c), (i), (k) capped at 0.8 or 0.7.
- **Color Gradient**: Yellow (high metric values) to green (low metric values), indicating the metric’s magnitude across budget combinations.
### Detailed Analysis (Per Plot)
#### Top Row: Backdoor Scenarios
(a) **Backdoor-Vulnerability**
- Low budgets (sp=0, qm=0): ~0.05
- Mid budgets (sp=100, qm=2): ~0.39
- High budgets (sp=200, qm=4): ~0.70
- Trend: Metric *increases* with both budgets (surface slopes upward from low to high budgets).
(b) **Backdoor-Mitigation**
- Low budgets: ~0.04
- Mid budgets: ~0.43
- High budgets: ~0.72
- Trend: Similar to (a), metric increases with budgets.
(c) **Backdoor-Diagnosis** (z-axis max 0.8)
- Low budgets: ~0.02
- Mid budgets: ~0.10
- High budgets: ~0.51
- Trend: Metric increases with budgets, but overall lower than (a)/(b).
(d) **Backdoor-Treatment**
- Low budgets: ~0.10
- Mid budgets: ~0.77
- High budgets: ~0.77 (surface flattens at high budgets)
- Trend: Metric peaks at mid budgets, then plateaus.
(e) **Backdoor-Freebase**
- Low budgets: ~0.00
- Mid budgets: ~0.78
- High budgets: ~0.78 (surface flattens)
- Trend: Metric peaks at mid budgets, then plateaus.
(f) **Backdoor-WordNet**
- Low budgets: ~0.00
- Mid budgets: ~0.57
- High budgets: ~0.74
- Trend: Metric increases with budgets, steeper at high sp/qm.
#### Bottom Row: Targeted Scenarios
(g) **Targeted-Vulnerability**
- Low budgets: ~0.98
- Mid budgets: ~0.61
- High budgets: ~0.02
- Trend: Metric *decreases* with both budgets (surface slopes downward from low to high budgets).
(h) **Targeted-Mitigation**
- Low budgets: ~0.91
- Mid budgets: ~0.55
- High budgets: ~0.00
- Trend: Similar to (g), metric decreases with budgets.
(i) **Targeted-Diagnosis** (z-axis max 0.8)
- Low budgets: ~0.66
- Mid budgets: ~0.43
- High budgets: ~0.07
- Trend: Metric decreases with budgets, overall lower than (g)/(h).
(j) **Targeted-Treatment** (z-axis max 0.8)
- Low budgets: ~0.78
- Mid budgets: ~0.75
- High budgets: ~0.45
- Trend: Metric decreases with budgets, but mid budgets are close to low.
(k) **Targeted-Freebase** (z-axis max 0.7)
- Low budgets: ~0.67
- Mid budgets: ~0.27
- High budgets: ~0.20
- Trend: Metric decreases with budgets, steeper at mid budgets.
(l) **Targeted-WordNet** (z-axis max 0.8)
- Low budgets: ~0.88
- Mid budgets: ~0.47
- High budgets: ~0.14
- Trend: Metric decreases with budgets, steeper at mid budgets.
### Key Observations
- **Backdoor vs. Targeted Trends**: Backdoor scenarios (top row) show *increasing* metric with budgets (surface slopes upward), while Targeted scenarios (bottom row) show *decreasing* metric (surface slopes downward).
- **Subcategory Variation**: Within Backdoor, "Vulnerability" and "Mitigation" have higher peak values (~0.70–0.72) than "Diagnosis" (~0.51) or "Treatment" (~0.77, but flat). Within Targeted, "Vulnerability" and "Mitigation" have higher low-budget values (~0.91–0.98) than "Diagnosis" (~0.66) or "Treatment" (~0.78).
- **Budget Sensitivity**: Most plots show strong sensitivity to both budgets (steep surface gradients), except "Backdoor-Treatment" and "Backdoor-Freebase" (flat at high budgets) and "Targeted-Treatment" (mild gradient at mid budgets).
### Interpretation
These plots likely represent the impact of two budget parameters (ROAR_sp and ROAR_qm) on a model’s vulnerability or performance under backdoor vs. targeted attacks. The contrasting trends (increasing for Backdoor, decreasing for Targeted) suggest:
- **Backdoor Attacks**: Higher budgets (more resources) increase vulnerability/performance (e.g., attack success or model robustness).
- **Targeted Attacks**: Higher budgets decrease vulnerability/performance (e.g., attack success or model robustness).
Subcategory differences (e.g., "Vulnerability" vs. "Diagnosis") imply varying sensitivity to budgets across attack phases or model components. The flat regions (e.g., Backdoor-Treatment) suggest diminishing returns or saturation at high budgets.
This data could inform resource allocation for model defense: prioritize budgets for Backdoor scenarios (where more resources help) and optimize for Targeted scenarios (where more resources hurt).