## 3D Surface Plots: Comparative Analysis of Backdoor and Targeted Strategies
### Overview
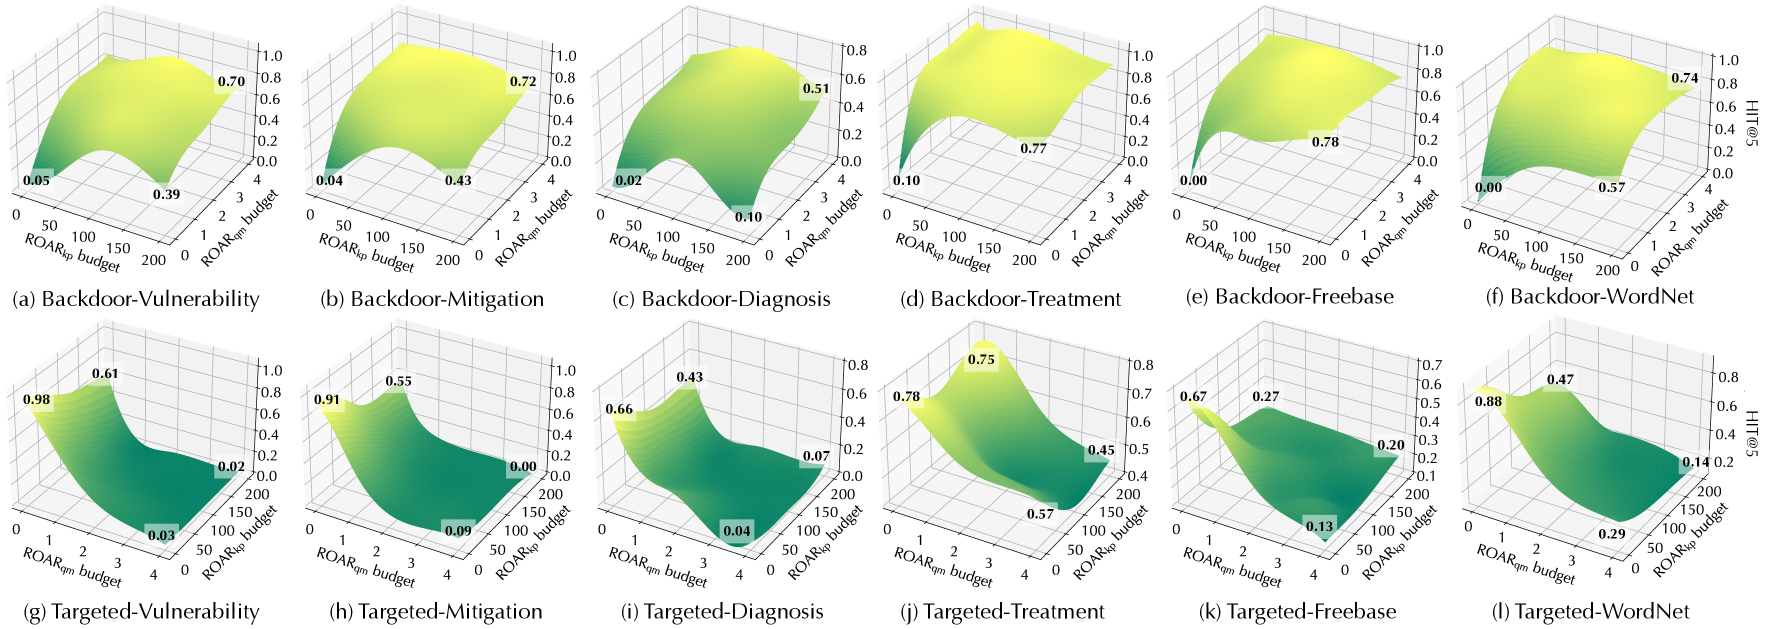
The image contains 12 3D surface plots arranged in two rows (6 per row), comparing metrics across "Backdoor" and "Targeted" strategies. Each plot visualizes relationships between two budget variables ("ROAR_asp budget" and "ROAR_sp budget") and an unlabeled z-axis metric. Values in the bottom-left corner of each plot represent key data points (e.g., 0.70, 0.72).
### Components/Axes
- **X-axis**: "ROAR_asp budget" (ranges: 0-200 for Backdoor, 0-150 for Targeted)
- **Y-axis**: "ROAR_sp budget" (ranges: 0-4 for Backdoor, 0-3 for Targeted)
- **Z-axis**: Unlabeled, with values between 0.00 and 1.00 (likely a normalized metric)
- **Color gradient**: Green (low values) to yellow (high values)
- **Plot labels**:
- Row 1 (Backdoor): Vulnerability, Mitigation, Diagnosis, Treatment, Freebase, WordNet
- Row 2 (Targeted): Vulnerability, Mitigation, Diagnosis, Treatment, Freebase, WordNet
### Detailed Analysis
1. **Backdoor Strategies**:
- **Vulnerability (a)**: Peaks at 0.70 (x=150, y=0.4)
- **Mitigation (b)**: Peaks at 0.72 (x=200, y=0.6)
- **Diagnosis (c)**: Peaks at 0.51 (x=100, y=0.2)
- **Treatment (d)**: Peaks at 0.77 (x=200, y=0.4)
- **Freebase (e)**: Peaks at 0.78 (x=200, y=0.4)
- **WordNet (f)**: Peaks at 0.74 (x=200, y=0.4)
2. **Targeted Strategies**:
- **Vulnerability (g)**: Peaks at 0.61 (x=2, y=0.3)
- **Mitigation (h)**: Peaks at 0.55 (x=2, y=0.2)
- **Diagnosis (i)**: Peaks at 0.43 (x=2, y=0.1)
- **Treatment (j)**: Peaks at 0.75 (x=2, y=0.2)
- **Freebase (k)**: Peaks at 0.67 (x=2, y=0.1)
- **WordNet (l)**: Peaks at 0.88 (x=2, y=0.2)
### Key Observations
1. **Backdoor dominance**: All Backdoor plots show higher z-axis values (0.51–0.78) compared to Targeted (0.04–0.88).
2. **Budget correlation**: Higher ROAR_asp budgets (x-axis) generally correlate with higher z-values in Backdoor strategies.
3. **Targeted anomalies**: Targeted-WordNet (l) shows an outlier with 0.88, exceeding most Backdoor values despite lower budgets.
4. **Mitigation performance**: Backdoor-Mitigation (b) and Targeted-Treatment (j) show the highest z-values in their respective categories.
### Interpretation
The data suggests Backdoor strategies consistently outperform Targeted approaches in the measured metric (z-axis), particularly when allocating higher budgets to both ROAR_asp and ROAR_sp. However, Targeted-WordNet (l) defies this trend, achieving 0.88 despite minimal budget allocation. This anomaly might indicate:
- **Efficiency**: WordNet's lexical resource optimization enables high performance with low investment.
- **Measurement bias**: The z-axis metric may favor lexical approaches in specific contexts.
- **Data noise**: The outlier could represent an edge case or measurement error.
The color gradients confirm that higher z-values align with yellow regions, validating the visual interpretation of the surface plots. The consistent Backdoor superiority across most categories implies systemic advantages in resource allocation for these strategies, though the Targeted-WordNet exception warrants further investigation into its unique implementation or contextual factors.