## Combined Chart: Energy and Correlation vs. Position
### Overview
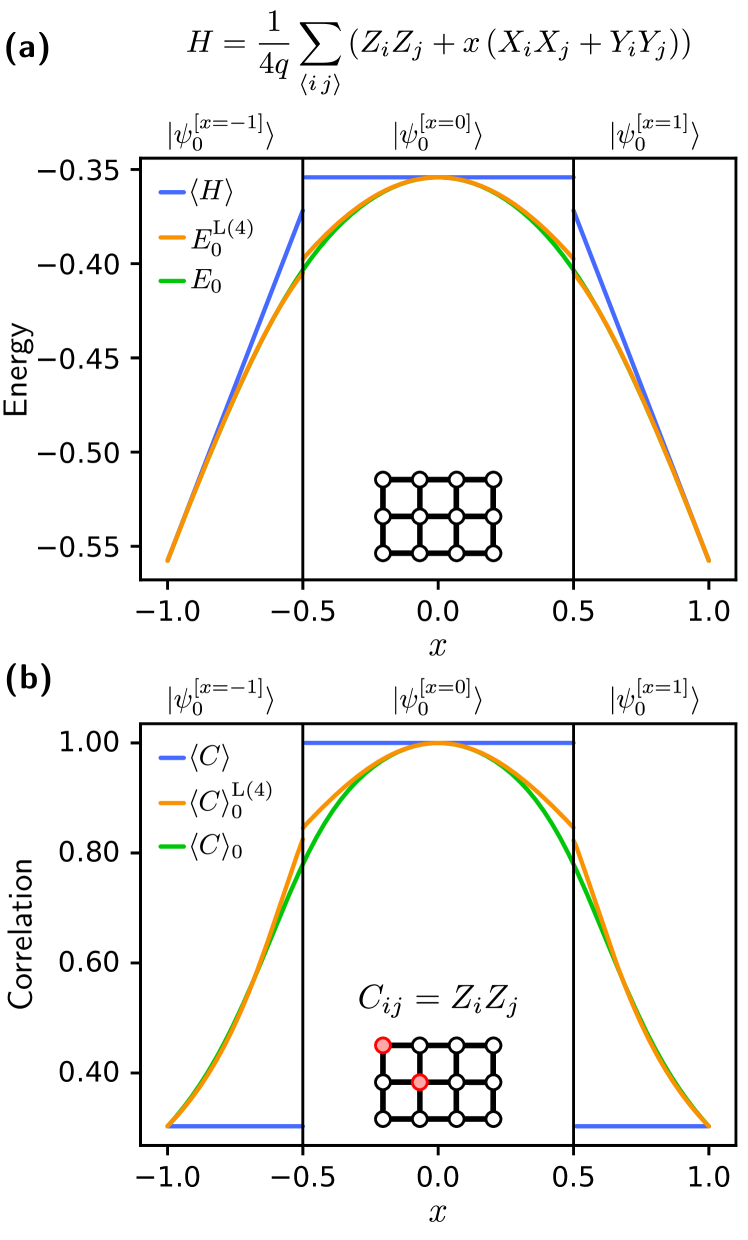
The image presents two line charts, (a) and (b), displaying the relationship between position (x) and energy (H, E0^(L(4)), E0) in chart (a), and position (x) and correlation (C, C0^(L(4)), C0) in chart (b). Both charts share the same x-axis and are divided into three regions, corresponding to different states denoted as |ψ0^(x=-1)>, |ψ0^(x=0)>, and |ψ0^(x=1)>. The charts also include diagrams of a 3x3 grid, representing a lattice structure, with specific elements highlighted in chart (b).
### Components/Axes
**Chart (a): Energy vs. Position**
* **Title:** (a)
* **Y-axis:** Energy, with a scale from -0.55 to -0.35 in increments of 0.05.
* **X-axis:** x, with a scale from -1.0 to 1.0 in increments of 0.5.
* **Vertical Dividers:** Vertical black lines at x = -0.5 and x = 0.5, separating the regions.
* **Regions:**
* Left: |ψ0^(x=-1)>
* Middle: |ψ0^(x=0)>
* Right: |ψ0^(x=1)>
* **Lattice Diagram:** A 3x3 grid of nodes connected by lines, centered below the x-axis.
* **Formula:** H = (1/4q) * Σ(i,j) (ZiZj + x(XiXj + YiYj)) located at the top of the chart.
* **Legend (Top-Left):**
* Blue: <H>
* Orange: E0^(L(4))
* Green: E0
**Chart (b): Correlation vs. Position**
* **Title:** (b)
* **Y-axis:** Correlation, with a scale from 0.40 to 1.00 in increments of 0.20.
* **X-axis:** x, with a scale from -1.0 to 1.0 in increments of 0.5.
* **Vertical Dividers:** Vertical black lines at x = -0.5 and x = 0.5, separating the regions.
* **Regions:**
* Left: |ψ0^(x=-1)>
* Middle: |ψ0^(x=0)>
* Right: |ψ0^(x=1)>
* **Lattice Diagram:** A 3x3 grid of nodes connected by lines, with two nodes highlighted in red.
* **Formula:** Cij = ZiZj located near the lattice diagram.
* **Legend (Top-Left):**
* Blue: <C>
* Orange: <C>0^(L(4))
* Green: <C>0
### Detailed Analysis
**Chart (a): Energy vs. Position**
* **<H> (Blue):** The line is constant at approximately -0.36 in the region -0.5 < x < 0.5. It decreases linearly from approximately -0.36 at x = -0.5 to approximately -0.56 at x = -1.0, and from approximately -0.36 at x = 0.5 to approximately -0.56 at x = 1.0.
* **E0^(L(4)) (Orange):** The line forms a curve that is approximately -0.36 at x = -0.5 and x = 0.5, and reaches a maximum of approximately -0.35 at x = 0.0. It decreases linearly from approximately -0.36 at x = -0.5 to approximately -0.56 at x = -1.0, and from approximately -0.36 at x = 0.5 to approximately -0.56 at x = 1.0.
* **E0 (Green):** The line forms a curve that is approximately -0.39 at x = -0.5 and x = 0.5, and reaches a maximum of approximately -0.36 at x = 0.0. It decreases linearly from approximately -0.39 at x = -0.5 to approximately -0.56 at x = -1.0, and from approximately -0.39 at x = 0.5 to approximately -0.56 at x = 1.0.
**Chart (b): Correlation vs. Position**
* **<C> (Blue):** The line is constant at approximately 1.0 in the region -0.5 < x < 0.5. It decreases linearly from approximately 1.0 at x = -0.5 to approximately 0.3 at x = -1.0, and from approximately 1.0 at x = 0.5 to approximately 0.3 at x = 1.0.
* **<C>0^(L(4)) (Orange):** The line forms a curve that is approximately 1.0 at x = -0.5 and x = 0.5, and reaches a maximum of approximately 0.98 at x = 0.0. It decreases linearly from approximately 1.0 at x = -0.5 to approximately 0.3 at x = -1.0, and from approximately 1.0 at x = 0.5 to approximately 0.3 at x = 1.0.
* **<C>0 (Green):** The line forms a curve that is approximately 0.85 at x = -0.5 and x = 0.5, and reaches a maximum of approximately 0.95 at x = 0.0. It decreases linearly from approximately 0.85 at x = -0.5 to approximately 0.3 at x = -1.0, and from approximately 0.85 at x = 0.5 to approximately 0.3 at x = 1.0.
### Key Observations
* Both charts show a distinct change in behavior at x = -0.5 and x = 0.5, corresponding to the boundaries of the |ψ0^(x=0)> region.
* Within the |ψ0^(x=0)> region, the energy values are relatively constant for <H>, while the correlation values are constant for <C>.
* Outside the |ψ0^(x=0)> region, all data series exhibit a linear decrease as x moves away from 0.
* The lattice diagram in chart (b) highlights two nodes, suggesting a specific correlation (Cij) between them.
### Interpretation
The charts illustrate how energy and correlation change with position (x) under different conditions, represented by the states |ψ0^(x=-1)>, |ψ0^(x=0)>, and |ψ0^(x=1)>. The constant values within the |ψ0^(x=0)> region suggest a stable or uniform state, while the linear decrease outside this region indicates a change or decay in energy and correlation. The lattice diagrams provide a visual representation of the system being studied, and the highlighted nodes in chart (b) emphasize the correlation between specific elements within the lattice. The formulas provided give the mathematical relationships being explored. The differences between the blue, orange, and green lines in each chart likely represent different levels of approximation or different theoretical models used to calculate the energy and correlation.