\n
## Diagram: Human Memory vs. LLM-driven Memory
### Overview
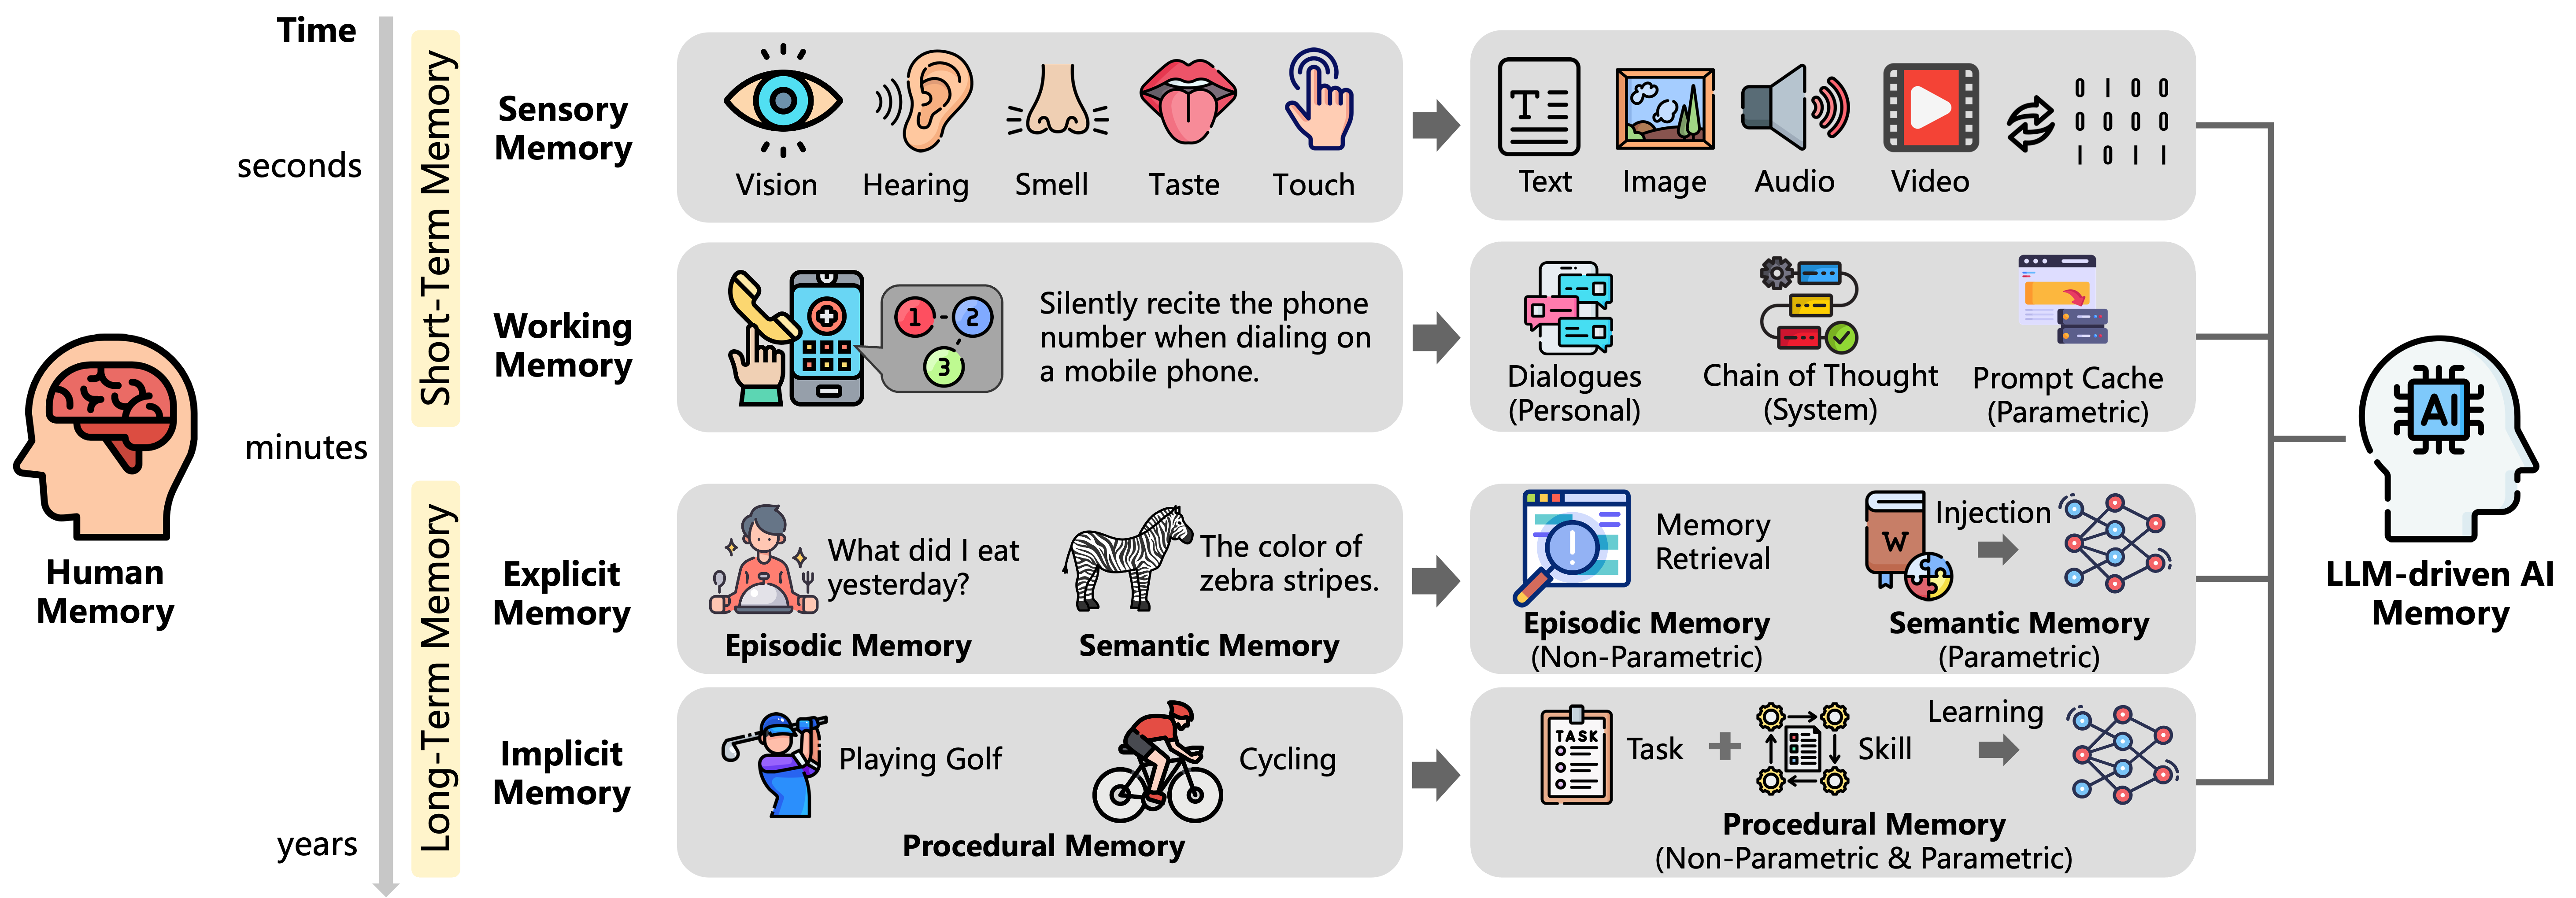
This diagram illustrates a comparison between human memory and LLM (Large Language Model)-driven memory, categorized by time scale (seconds, minutes, years) and memory type (Sensory, Working, Explicit, Implicit). It visually represents how different types of information are stored and accessed in each system. The diagram uses icons and short text descriptions to represent each memory component.
### Components/Axes
* **Y-Axis (Vertical):** Memory Type – Sensory Memory, Working Memory, Explicit Memory, Implicit Memory. The scale is logarithmic, ranging from seconds (top) to years (bottom).
* **X-Axis (Horizontal):** Represents the progression from Human Memory (left) to LLM-driven Memory (right).
* **Time Scale:** Labeled as "Time" on the left side, with markers for "seconds", "minutes", and "years".
* **Human Memory:** Represented by a brain icon on the left side.
* **LLM-driven Memory:** Represented by a stylized AI brain icon on the right side.
### Detailed Analysis or Content Details
**1. Sensory Memory (Seconds):**
* **Vision:** Eye icon.
* **Hearing:** Ear icon.
* **Smell:** Nose icon.
* **Taste:** Tongue icon.
* **Touch:** Hand icon.
* **Text:** Text message bubble icon.
* **Image:** Picture frame icon.
* **Audio:** Speaker icon.
* **Video:** Film reel icon.
**2. Working Memory (Minutes):**
* **Human:** A smartphone with a dialing screen. Text: "Silently recite the phone number when dialing on a mobile phone."
* **LLM:**
* **Dialogues (Personal):** Speech bubble icon with multiple lines.
* **Chain of Thought (System):** Interconnected boxes representing thought processes.
* **Prompt Cache (Parametric):** A cache icon.
**3. Explicit Memory (Long-Term - Minutes/Years):**
* **Human:**
* **Episodic Memory:** A question mark inside a thought bubble. Text: "What did I eat yesterday?"
* **Semantic Memory:** A zebra stripe pattern. Text: "The color of zebra stripes."
* **LLM:**
* **Episodic Memory (Non-Parametric):** A person icon with a speech bubble. Text: "Memory Retrieval".
* **Semantic Memory (Parametric):** A letter "W" inside a circle. Text: "Injection".
**4. Implicit Memory (Long-Term - Years):**
* **Human:**
* **Procedural Memory:**
* Golf club and ball icon. Text: "Playing Golf".
* Bicycle icon. Text: "Cycling".
* **LLM:**
* **Procedural Memory (Non-Parametric & Parametric):**
* Task icon with a plus sign. Text: "Task + Skill".
* Gear icon. Text: "Learning".
### Key Observations
* The diagram clearly differentiates between human and LLM memory systems.
* The time scale is a key organizing principle, showing how different memory types operate over different durations.
* LLM memory is explicitly categorized as "Parametric" or "Non-Parametric" where applicable, a distinction not made for human memory.
* The diagram uses relatable examples (reciting a phone number, remembering what you ate) to illustrate the different memory types.
* The LLM side focuses on concepts like prompt caching and chain of thought, reflecting the mechanisms of LLM operation.
### Interpretation
The diagram suggests that while LLMs can mimic certain aspects of human memory, the underlying mechanisms and capabilities are fundamentally different. Human memory is presented as a holistic system encompassing sensory experiences, working memory, and long-term storage of both explicit and implicit knowledge. LLM memory, on the other hand, is depicted as more modular and reliant on parametric and non-parametric approaches. The categorization of LLM memory as "parametric" vs. "non-parametric" highlights the importance of model weights and learned parameters in its operation, a concept less directly applicable to human memory. The diagram implies that LLMs excel at tasks requiring rapid access to stored information (prompt caching) and complex reasoning (chain of thought), while human memory is more nuanced and adaptable, encompassing a wider range of experiences and skills. The use of icons and simple text descriptions makes the diagram accessible and effectively communicates the key differences between these two memory systems. The diagram doesn't provide quantitative data, but rather a conceptual framework for understanding the similarities and differences.