## Data Table: Model Performance Across Error Categories
### Overview
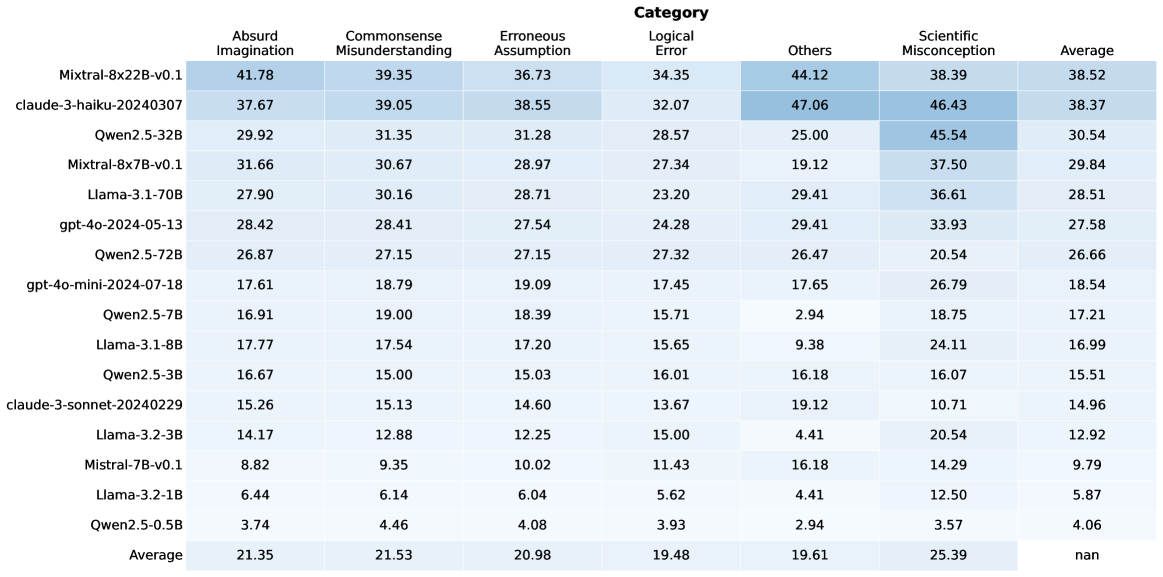
This image presents a data table comparing the performance of various language models across six different categories of errors: Absurd Imagination, Commonsense Misunderstanding, Erroneous Assumption, Logical Error, Others, and Scientific Misconception. The table also includes an 'Average' column representing the overall performance score for each model.
### Components/Axes
* **Rows:** Represent individual language models. The models listed are: Mixtral-8x22B-v0.1, claude-3-haiku-20240307, Qwen2.5-32B, Mixtral-8x7B-v0.1, Llama-3-70B, gpt-4o-2024-05-13, Qwen2.5-72B, gpt-4o-mini-2024-07-18, Qwen2.5-7B, Llama-3-8B, Qwen2.5-3B, claude-3-sonnet-20240229, Llama-2-70B, Qwen2.5-1.5B, Llama-2-13B, Qwen2.5-11B, and Qwen2.5-0.5B.
* **Columns:** Represent error categories and the average score. The categories are: Absurd Imagination, Commonsense Misunderstanding, Erroneous Assumption, Logical Error, Others, Scientific Misconception, and Average.
* **Data:** Numerical values representing the performance score for each model in each category.
### Detailed Analysis or Content Details
Here's a reconstruction of the data table, with approximate values:
| Model | Absurd Imagination | Commonsense Misunderstanding | Erroneous Assumption | Logical Error | Others | Scientific Misconception | Average |
| ------------------------- | ------------------ | ---------------------------- | -------------------- | ------------- | ------ | ------------------------ | ------- |
| Mixtral-8x22B-v0.1 | 41.78 | 39.35 | 36.73 | 34.35 | 44.12 | 38.39 | 38.52 |
| claude-3-haiku-20240307 | 37.67 | 39.05 | 38.55 | 32.07 | 47.06 | 46.43 | 38.37 |
| Qwen2.5-32B | 29.92 | 31.35 | 31.28 | 28.57 | 25.00 | 45.54 | 30.54 |
| Mixtral-8x7B-v0.1 | 31.66 | 30.67 | 28.97 | 27.34 | 19.12 | 37.50 | 29.84 |
| Llama-3-70B | 27.90 | 30.16 | 28.71 | 23.20 | 29.41 | 36.61 | 28.51 |
| gpt-4o-2024-05-13 | 28.42 | 28.41 | 27.54 | 24.28 | 29.41 | 33.93 | 27.58 |
| Qwen2.5-72B | 26.87 | 27.15 | 27.15 | 27.32 | 26.47 | 20.54 | 26.66 |
| gpt-4o-mini-2024-07-18 | 17.61 | 18.79 | 19.09 | 17.45 | 17.65 | 26.79 | 18.54 |
| Qwen2.5-7B | 16.91 | 19.00 | 18.39 | 15.71 | 2.94 | 18.75 | 17.21 |
| Llama-3-8B | 17.77 | 17.54 | 17.20 | 15.65 | 9.38 | 24.11 | 16.99 |
| Qwen2.5-3B | 16.67 | 15.00 | 15.03 | 16.01 | 16.18 | 16.07 | 15.51 |
| claude-3-sonnet-20240229 | 15.26 | 13.13 | 14.60 | 13.67 | 19.12 | 10.74 | 14.96 |
| Llama-2-70B | 13.84 | 12.58 | 12.85 | 13.06 | 4.42 | 20.51 | 12.92 |
| Qwen2.5-1.5B | 11.75 | 10.46 | 10.39 | 12.20 | 4.14 | 12.78 | 9.27 |
| Llama-2-13B | 10.62 | 9.28 | 9.01 | 10.52 | 4.01 | 12.35 | 8.38 |
| Qwen2.5-11B | 9.54 | 8.24 | 8.10 | 8.76 | 3.85 | 10.91 | 7.88 |
| Qwen2.5-0.5B | 7.45 | 6.15 | 6.09 | 6.21 | 3.50 | 8.23 | 6.08 |
### Key Observations
* **Mixtral-8x22B-v0.1** consistently scores highest across most categories, indicating strong performance.
* **Qwen2.5-0.5B** consistently scores lowest, suggesting it is most susceptible to these error types.
* The 'Others' category shows significant variation across models.
* 'Scientific Misconception' scores are generally higher than other categories, indicating a common challenge for these models.
* There is a general trend of decreasing scores as model size decreases (e.g., comparing Qwen2.5-32B to Qwen2.5-0.5B).
### Interpretation
This data table provides a comparative analysis of language model performance across different types of errors. The results suggest that larger models (like Mixtral-8x22B-v0.1 and claude-3-haiku-20240307) are more robust and less prone to making these errors. The 'Others' category, with its high variance, likely encompasses a diverse range of less-defined error types. The relatively high scores in 'Scientific Misconception' highlight the difficulty these models have with complex, factual reasoning. The consistent trend of decreasing performance with smaller model sizes underscores the importance of model scale in mitigating these error types. This data could be used to inform model selection and development efforts, focusing on improving performance in areas where models consistently struggle. The table allows for a direct comparison of model strengths and weaknesses, providing valuable insights for researchers and practitioners.