## Table: AI Model Performance Across Error Categories
### Overview
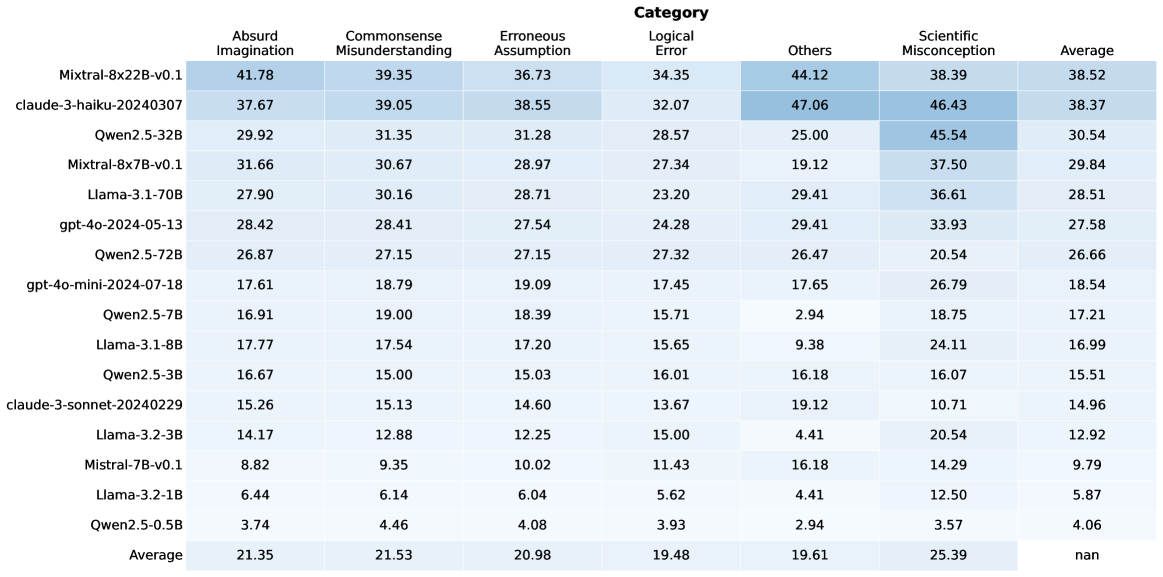
The image displays a data table comparing the performance of various large language models (LLMs) across six distinct error categories. The table is structured as a heatmap-style grid, with model names as rows and error categories as columns. Each cell contains a numerical value, likely representing a percentage or score indicating the model's error rate or performance in that category. The table includes an "Average" column on the far right and an "Average" row at the bottom.
### Components/Axes
* **Row Headers (Leftmost Column):** Lists 15 distinct AI model identifiers.
* **Column Headers (Top Row):** Lists 6 error categories and a final "Average" column.
* **Categories:** Absurd Imagination, Commonsense Misunderstanding, Erroneous Assumption, Logical Error, Others, Scientific Misconception.
* **Data Grid:** A 15x7 grid of numerical values. The background color of cells varies in shades of blue, with darker shades corresponding to higher numerical values, creating a visual heatmap effect.
* **Footer Row:** A final row labeled "Average" provides the column-wise average for each category.
### Detailed Analysis
**Table Structure and Data:**
| Model Name | Absurd Imagination | Commonsense Misunderstanding | Erroneous Assumption | Logical Error | Others | Scientific Misconception | Average |
| :--- | :--- | :--- | :--- | :--- | :--- | :--- | :--- |
| **Mixtral-8x22B-v0.1** | 41.78 | 39.35 | 36.73 | 34.35 | 44.12 | 38.39 | 38.52 |
| **claude-3-haiku-20240307** | 37.67 | 39.05 | 38.55 | 32.07 | 47.06 | 46.43 | 38.37 |
| **Qwen2.5-32B** | 29.92 | 31.35 | 31.28 | 28.57 | 25.00 | 45.54 | 30.54 |
| **Mixtral-8x7B-v0.1** | 31.66 | 30.67 | 28.97 | 27.34 | 19.12 | 37.50 | 29.84 |
| **Llama-3.1-70B** | 27.90 | 30.16 | 28.71 | 23.20 | 29.41 | 36.61 | 28.51 |
| **gpt-4o-2024-05-13** | 28.42 | 28.41 | 27.54 | 24.28 | 29.41 | 33.93 | 27.58 |
| **Qwen2.5-72B** | 26.87 | 27.15 | 27.15 | 27.32 | 26.47 | 20.54 | 26.66 |
| **gpt-4o-mini-2024-07-18** | 17.61 | 18.79 | 19.09 | 17.45 | 17.65 | 26.79 | 18.54 |
| **Qwen2.5-7B** | 16.91 | 19.00 | 18.39 | 15.71 | 2.94 | 18.75 | 17.21 |
| **Llama-3.1-8B** | 17.77 | 17.54 | 17.20 | 15.65 | 9.38 | 24.11 | 16.99 |
| **Qwen2.5-3B** | 16.67 | 15.00 | 15.03 | 16.01 | 16.18 | 16.07 | 15.51 |
| **claude-3-sonnet-20240229** | 15.26 | 15.13 | 14.60 | 13.67 | 19.12 | 10.71 | 14.96 |
| **Llama-3.2-3B** | 14.17 | 12.88 | 12.25 | 15.00 | 4.41 | 20.54 | 12.92 |
| **Mistral-7B-v0.1** | 8.82 | 9.35 | 10.02 | 11.43 | 16.18 | 14.29 | 9.79 |
| **Llama-3.2-1B** | 6.44 | 6.14 | 6.04 | 5.62 | 4.41 | 12.50 | 5.87 |
| **Qwen2.5-0.5B** | 3.74 | 4.46 | 4.08 | 3.93 | 2.94 | 3.57 | 4.06 |
| **Average** | **21.35** | **21.53** | **20.98** | **19.48** | **19.61** | **25.39** | **nan** |
**Note on "nan":** The cell at the intersection of the "Average" row and "Average" column contains the text "nan" (not a number), indicating this value is not calculated or not applicable.
### Key Observations
1. **Performance Hierarchy:** There is a clear stratification. The top-performing models (e.g., Mixtral-8x22B-v0.1, claude-3-haiku) have average scores in the high 30s, while the smallest models (e.g., Qwen2.5-0.5B, Llama-3.2-1B) have averages below 6.
2. **Category Difficulty:** The "Scientific Misconception" category has the highest column average (25.39), suggesting it is the most challenging category for models overall. "Logical Error" has the lowest average (19.48).
3. **Model-Specific Strengths/Weaknesses:**
* **claude-3-haiku-20240307** has the highest single-category score in the table: 47.06 in "Others."
* **Qwen2.5-32B** shows a significant disparity, performing relatively poorly in "Others" (25.00) but exceptionally well in "Scientific Misconception" (45.54).
* **Qwen2.5-7B** has an extremely low score in "Others" (2.94), which is an outlier compared to its scores in other categories.
4. **Consistency:** Models like **Mixtral-8x22B-v0.1** and **claude-3-haiku-20240307** show relatively consistent, high scores across all categories. Smaller models show more variability.
### Interpretation
This table provides a comparative benchmark of LLMs on specific types of reasoning failures. The data suggests that model scale (parameter count) is a strong, but not perfect, predictor of performance, as larger models generally occupy the top rows. However, the performance of specific model families (like Qwen2.5) varies significantly across sizes and categories, indicating that architecture and training data also play crucial roles.
The high average error rate in "Scientific Misconception" implies that current models, even top ones, struggle significantly with factual scientific knowledge or reasoning. The "Others" category shows the widest variance between models, suggesting it may capture a diverse set of errors that some models are specifically better at avoiding.
The "nan" in the bottom-right corner is a minor data artifact, likely because averaging the row of averages would be statistically redundant. The heatmap coloring effectively draws the eye to the highest values (darkest blue), immediately highlighting the most challenging categories for each model and the strongest models in each category. This format allows for quick visual comparison beyond just the numerical values.