## Partition Diagram: Partition of Input Space
### Overview
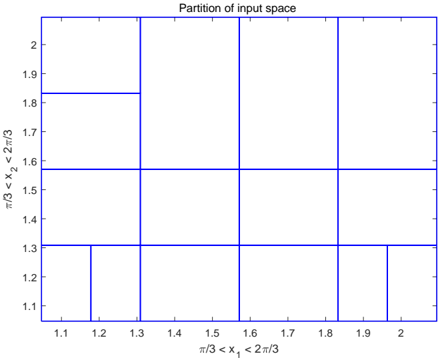
The image is a diagram showing the partition of an input space. The space is divided into rectangular regions by vertical and horizontal lines. The x-axis represents π/3 < x1 < 2π/3, and the y-axis represents π/3 < x2 < 2π/3. The diagram shows how the input space is divided into different regions.
### Components/Axes
* **Title:** Partition of input space
* **X-axis:** π/3 < x1 < 2π/3, with tick marks at 1.1, 1.2, 1.3, 1.4, 1.5, 1.6, 1.7, 1.8, 1.9, and 2.0.
* **Y-axis:** π/3 < x2 < 2π/3, with tick marks at 1.1, 1.2, 1.3, 1.4, 1.5, 1.6, 1.7, 1.8, 1.9, and 2.0.
* The diagram is composed of blue lines that partition the space.
### Detailed Analysis
The input space is partitioned into rectangular regions. The vertical lines are located at approximately x = 1.2, 1.3, 1.4, 1.5, 1.6, 1.8, 1.9, and 2.0. The horizontal lines are located at approximately y = 1.3, 1.6.
* **Region 1 (Bottom-Left):** Bounded by x = 1.1 to 1.2, and y = 1.1 to 1.3.
* **Region 2:** Bounded by x = 1.2 to 1.3, and y = 1.1 to 1.3.
* **Region 3:** Bounded by x = 1.3 to 1.4, and y = 1.1 to 1.3.
* **Region 4:** Bounded by x = 1.4 to 1.5, and y = 1.1 to 1.3.
* **Region 5:** Bounded by x = 1.5 to 1.6, and y = 1.1 to 1.3.
* **Region 6:** Bounded by x = 1.6 to 1.8, and y = 1.1 to 1.3.
* **Region 7:** Bounded by x = 1.8 to 1.9, and y = 1.1 to 1.3.
* **Region 8:** Bounded by x = 1.9 to 2.0, and y = 1.1 to 1.3.
* **Region 9:** Bounded by x = 2.0 to 2.1, and y = 1.1 to 1.3.
* **Region 10:** Bounded by x = 1.1 to 1.3, and y = 1.3 to 1.6.
* **Region 11:** Bounded by x = 1.3 to 1.6, and y = 1.3 to 1.6.
* **Region 12:** Bounded by x = 1.6 to 2.0, and y = 1.3 to 1.6.
* **Region 13:** Bounded by x = 2.0 to 2.1, and y = 1.3 to 1.6.
* **Region 14:** Bounded by x = 1.1 to 1.3, and y = 1.6 to 1.85.
* **Region 15:** Bounded by x = 1.1 to 1.3, and y = 1.85 to 2.05.
* **Region 16:** Bounded by x = 1.3 to 1.6, and y = 1.6 to 2.05.
* **Region 17:** Bounded by x = 1.6 to 1.8, and y = 1.6 to 2.05.
* **Region 18:** Bounded by x = 1.8 to 2.0, and y = 1.6 to 2.05.
* **Region 19:** Bounded by x = 2.0 to 2.1, and y = 1.6 to 2.05.
### Key Observations
The partitioning is non-uniform. The regions in the bottom-left corner are smaller than the regions in the top-right corner.
### Interpretation
The diagram represents a partitioning of the input space defined by π/3 < x1 < 2π/3 and π/3 < x2 < 2π/3. The partitioning is done using vertical and horizontal lines, creating rectangular regions. This type of partitioning is commonly used in machine learning and control systems to divide the input space into different regions, each of which may be associated with a different action or prediction. The non-uniform partitioning suggests that the regions in the bottom-left corner are more important or require finer granularity than the regions in the top-right corner.