## Diagram: Control System State Representation
### Overview
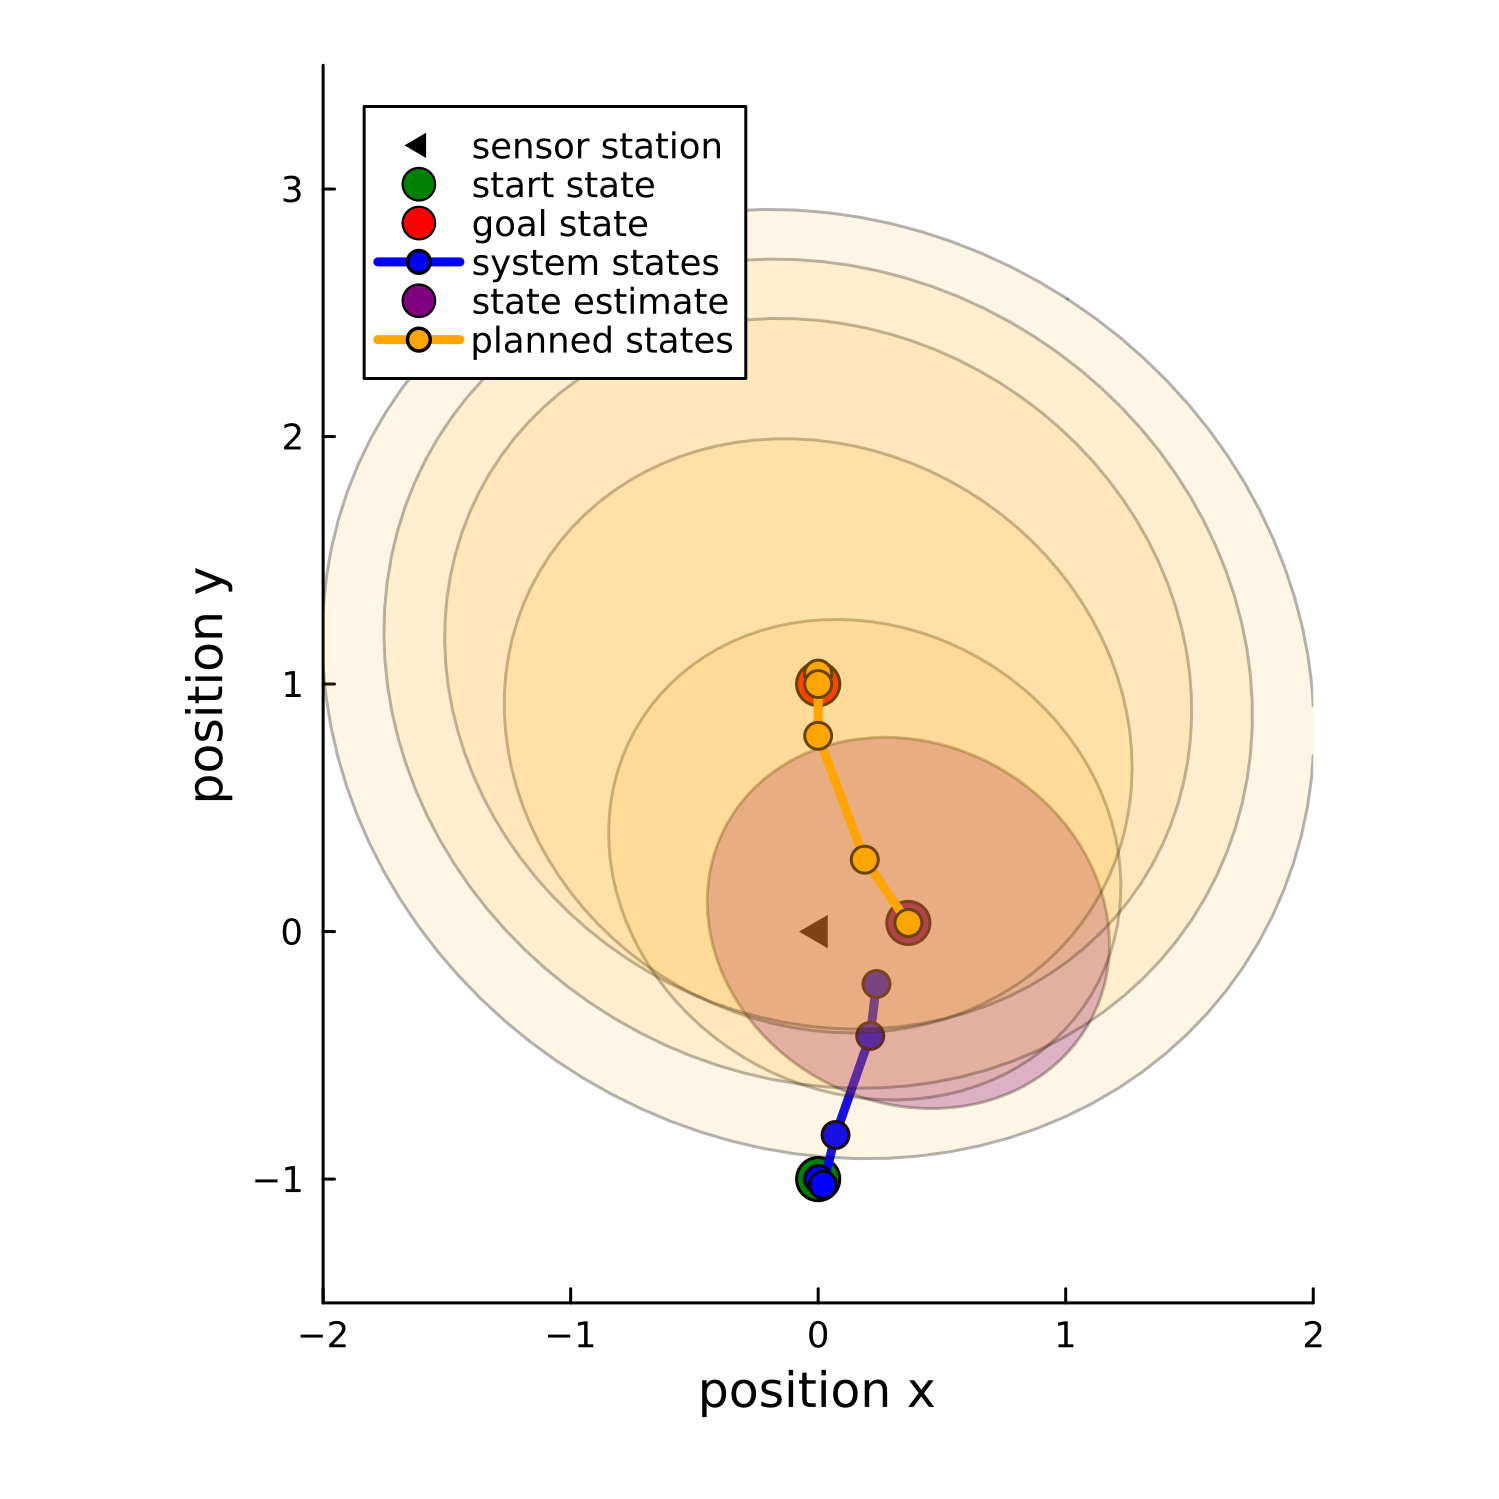
The diagram illustrates a 2D coordinate system representing a control system's state space. It includes multiple elements: sensor station, start/goal states, system states, state estimates, and planned states. The visualization uses concentric circles, colored markers, and connecting lines to depict relationships between system components.
### Components/Axes
- **Axes**:
- X-axis: "position x" (range: -2 to 2)
- Y-axis: "position y" (range: -2 to 2)
- **Legend** (top-left corner):
- `▲`: Sensor station (black)
- `●`: Start state (green)
- `●`: Goal state (red)
- `●`: System states (blue)
- `●`: State estimate (purple)
- `●`: Planned states (orange)
- **Key Elements**:
- Concentric orange circles centered at (0,1) (goal state)
- Black triangle at (-1,0) (sensor station)
- Green circle at (0,-1) (start state)
- Red circle at (0,1) (goal state)
- Blue dots along a path from start to goal (system states)
- Purple dots along the same path (state estimates)
- Orange dots along the path (planned states)
### Detailed Analysis
1. **Path Representation**:
- A straight line connects start (0,-1) to goal (0,1)
- Blue dots (system states) are spaced at approximately:
- (-0.5, -0.5)
- (0, -0.5)
- (0.5, 0)
- (0.5, 0.5)
- (0.5, 1)
- Purple dots (state estimates) align with system states but show slight deviations:
- (-0.4, -0.6)
- (0, -0.4)
- (0.4, 0.1)
- (0.4, 0.6)
- (0.4, 1.1)
- Orange dots (planned states) follow the same trajectory but with increasing spacing:
- (-0.3, -0.7)
- (0, -0.3)
- (0.3, 0.2)
- (0.3, 0.8)
- (0.3, 1.2)
2. **Sensor Station**:
- Positioned at (-1,0) with a black triangle marker
- Located outside the main trajectory path
3. **State Space**:
- Concentric orange circles centered at goal state (0,1) with radii:
- 0.5, 1.0, 1.5, 2.0 units
- These circles represent planned states expanding from the goal
### Key Observations
1. The system trajectory follows a straight vertical path from start to goal
2. State estimates (purple) show consistent deviation from actual system states (blue)
3. Planned states (orange) expand outward from the goal, suggesting predictive modeling
4. Sensor station position creates a 90° angle with the trajectory path
5. All state markers maintain x-coordinates between -0.5 and 0.5 except the sensor station
### Interpretation
This diagram represents a robotic navigation system with:
- **Sensor Fusion**: The sensor station (-1,0) likely provides environmental data
- **Path Planning**: The orange circles indicate potential future states expanding from the goal
- **State Estimation**: Purple dots show the system's uncertainty in position tracking
- **Control Dynamics**: The blue dots represent actual system states following a planned trajectory
The spatial relationship between sensor station and trajectory suggests the system uses lateral sensing for obstacle avoidance while maintaining a straight path to the goal. The deviation between system states and state estimates indicates potential sensor noise or processing delays in the control loop.