## [Chart/Diagram Type]: 2D Trajectory and State Estimation Plot
### Overview
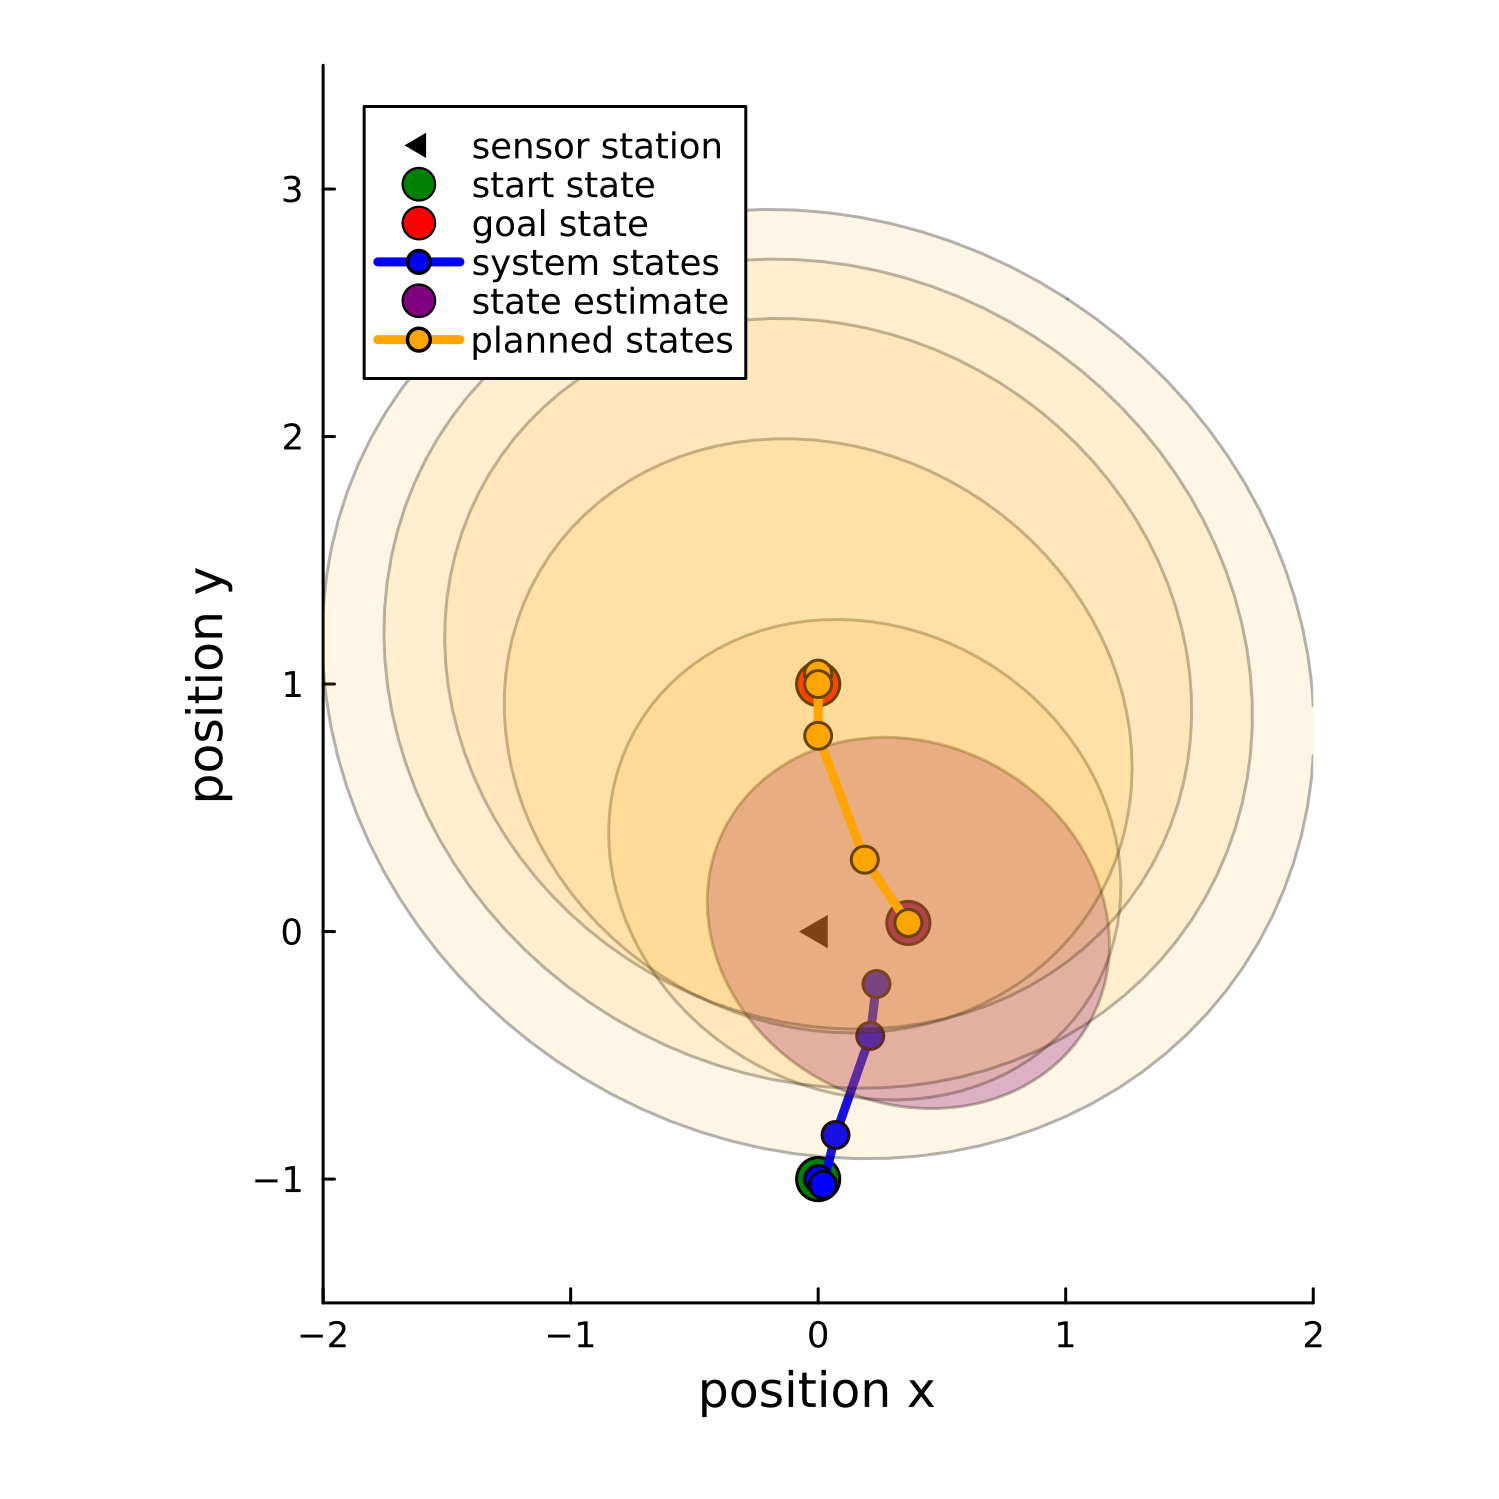
This image is a 2D coordinate plot visualizing the trajectory of an autonomous system. It displays the system's movement from a starting position, through a series of state estimates, and along a planned path. The plot includes a fixed sensor station, a goal state, and concentric uncertainty ellipses (covariance regions) indicating the system's confidence in its position or the environment.
### Components/Axes
* **Axes:**
* **X-axis:** Labeled "position x", ranging from -2 to 2.
* **Y-axis:** Labeled "position y", ranging from -1.5 to 3.5.
* **Legend (Top-Left):**
* **Black triangle:** "sensor station"
* **Green circle:** "start state"
* **Red circle:** "goal state"
* **Blue line/circle:** "system states"
* **Purple circle:** "state estimate"
* **Orange line/circle:** "planned states"
### Detailed Analysis
The plot maps the following spatial data points (approximate coordinates):
* **Sensor Station (Black Triangle):** Located at the origin (0, 0).
* **Start State (Green Circle):** Located at (0, -1).
* **System States (Blue Line/Circles):**
* The path begins at the start state (0, -1).
* It moves upward and slightly right to approximately (0.1, -0.8).
* It continues to approximately (0.2, -0.4).
* **State Estimate (Purple Line/Circles):**
* The path continues from the last blue point (~0.2, -0.4).
* It moves to approximately (0.2, -0.2).
* **Goal State (Red Circle):** Located at approximately (0.35, 0.05).
* **Planned States (Orange Line/Circles):**
* The path begins near the goal state at approximately (0.2, 0.05).
* It moves upward to (0.2, 0.3).
* It continues upward to (0.1, 0.8).
* It terminates at approximately (0.1, 1.0).
* **Uncertainty Ellipses:**
* There are multiple concentric, semi-transparent beige/orange ellipses.
* These are centered roughly at (0, 1).
* The ellipses represent increasing levels of uncertainty, with the largest ellipse extending from roughly x = -1.5 to 1.5 and y = -0.5 to 3.0.
### Key Observations
* **Trajectory Flow:** The system moves from the bottom (start) toward the sensor station (origin), then pivots.
* **Divergence:** The "Planned States" (orange) move away from the "Goal State" (red) and head directly into the region of highest uncertainty (the center of the concentric ellipses).
* **Uncertainty Concentration:** The uncertainty ellipses are centered at (0, 1), which is directly "above" the sensor station. The planned path terminates exactly in the center of this high-uncertainty region.
* **Spatial Relationship:** The "Goal State" is positioned very close to the sensor station (0,0), while the "Planned States" move away from this goal toward the higher-uncertainty region.
### Interpretation
This diagram likely represents a path-planning algorithm in a robotics or control theory context, possibly involving **Active Perception** or **Exploration**.
* **The "Why":** The system does not simply move to the "Goal State" (red). Instead, it moves to the goal, then immediately plans a path (orange) that leads away from the goal and into the region of highest uncertainty (the center of the ellipses).
* **Peircean Investigative Reading:**
* The "Goal State" may be a temporary waypoint or a location where the system has already gathered sufficient information.
* The movement into the high-uncertainty region (the center of the ellipses) suggests the system is performing an "information-gathering" maneuver. It is intentionally moving into an area where its state estimate is less certain (or where the environment is less known) to reduce that uncertainty.
* The concentric ellipses represent the covariance of the system's position estimate; the system is prioritizing moving toward the center of this uncertainty, likely to improve its localization or map the environment in that specific area.