## Diagram: Dimension Pruning Process
### Overview
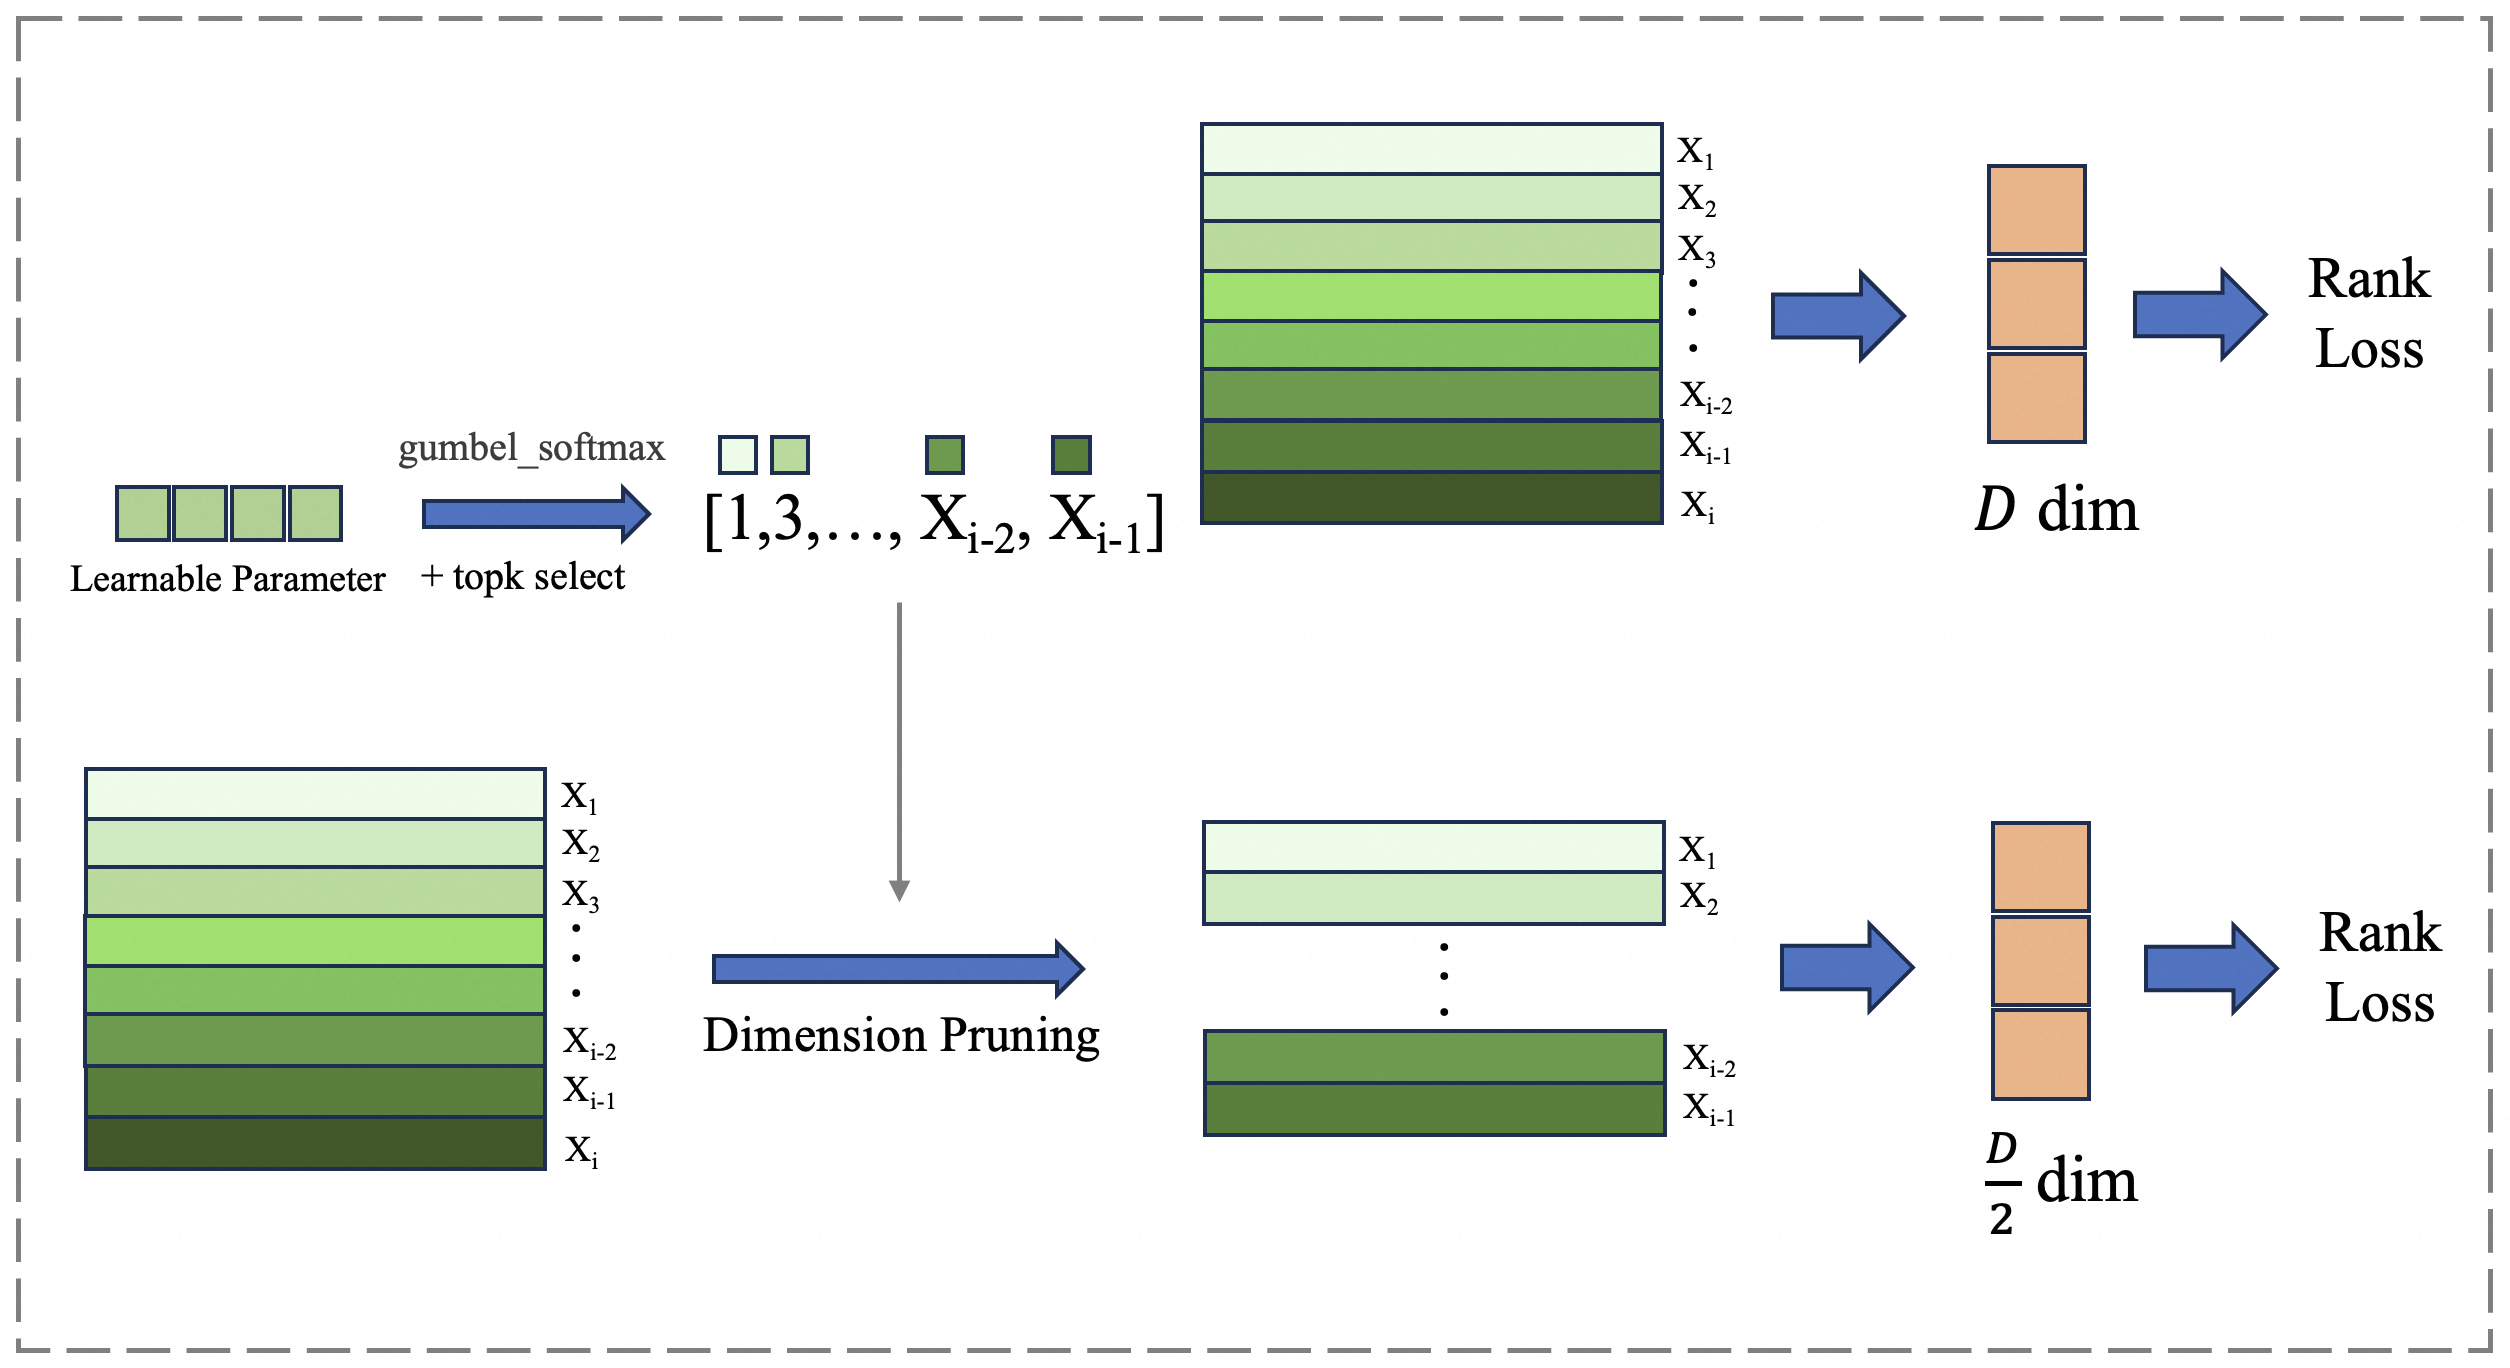
The image illustrates a dimension pruning process, likely within a machine learning or neural network context. It shows how an initial set of features or dimensions is reduced through a series of operations, ultimately leading to a rank loss calculation. The diagram is split into two parallel paths, both starting with a similar initial state but undergoing different pruning strategies.
### Components/Axes
* **Input:** The process begins with a "Learnable Parameter" block, followed by "gumbel_softmax + topk select" operation, resulting in a selection of dimensions represented as "[1,3,..., X<sub>i-2</sub>, X<sub>i-1</sub>]".
* **Dimension Representation:** The dimensions are visually represented as stacked horizontal bars, with varying shades of green, labeled from X<sub>1</sub> to X<sub>i</sub>. The shading appears to indicate some form of weighting or importance, with darker shades potentially representing higher importance.
* **Dimension Pruning:** One path proceeds directly to a "D dim" representation, while the other path undergoes "Dimension Pruning" before reaching a "D/2 dim" representation.
* **Output:** Both paths culminate in a "Rank Loss" calculation.
* **Arrows:** Blue arrows indicate the flow of data and operations. A gray arrow indicates a direct selection of dimensions.
### Detailed Analysis
**Top Path:**
1. **Initial State:** Starts with "Learnable Parameter" and applies "gumbel_softmax + topk select" resulting in a selection of dimensions "[1,3,..., X<sub>i-2</sub>, X<sub>i-1</sub>]".
2. **Dimension Stack:** A stack of horizontal bars represents the dimensions X<sub>1</sub> to X<sub>i</sub>. The bars are shaded in a gradient from light green (top) to dark green (bottom).
* X<sub>1</sub> is the lightest shade of green.
* X<sub>i-2</sub> and X<sub>i-1</sub> are darker shades of green.
* X<sub>i</sub> is the darkest shade of green.
3. **D dim Representation:** The stack of dimensions is directly transformed into a "D dim" representation, visualized as three stacked orange blocks.
4. **Rank Loss:** The "D dim" representation is then used to calculate "Rank Loss".
**Bottom Path:**
1. **Initial State:** Starts with a similar stack of dimensions X<sub>1</sub> to X<sub>i</sub>, with the same shading pattern as the top path.
* X<sub>1</sub> is the lightest shade of green.
* X<sub>i-2</sub> and X<sub>i-1</sub> are darker shades of green.
* X<sub>i</sub> is the darkest shade of green.
2. **Dimension Pruning:** The stack undergoes "Dimension Pruning", resulting in a reduced stack of dimensions, labeled X<sub>1</sub>, X<sub>2</sub>, ..., X<sub>i-2</sub>, X<sub>i-1</sub>. The shading pattern is maintained.
3. **D/2 dim Representation:** The pruned stack is transformed into a "D/2 dim" representation, visualized as three stacked orange blocks.
4. **Rank Loss:** The "D/2 dim" representation is then used to calculate "Rank Loss".
### Key Observations
* The diagram highlights two different approaches to dimension reduction: one that directly uses the initial dimensions and another that prunes them before calculating rank loss.
* The shading of the dimension bars suggests a weighting or importance mechanism, potentially learned during training.
* The "Dimension Pruning" step reduces the dimensionality by half (D to D/2).
### Interpretation
The diagram illustrates a comparative analysis of two dimension reduction strategies within a machine learning pipeline. The top path represents a scenario where all initial dimensions are used to calculate rank loss, while the bottom path represents a scenario where dimensions are pruned before the rank loss calculation.
The "gumbel\_softmax + topk select" operation suggests a mechanism for selecting the most relevant dimensions based on learned parameters. The shading of the dimension bars likely reflects the importance assigned to each dimension by this selection process.
The "Dimension Pruning" step likely aims to reduce computational complexity and potentially improve generalization by removing less relevant dimensions. The comparison between the two paths allows for evaluating the impact of dimension pruning on the final rank loss.
The diagram suggests that the choice between using all dimensions or pruning them depends on the specific task and data characteristics. The optimal strategy would likely involve a trade-off between model complexity, computational cost, and generalization performance.