## Box Plots: Causal Effect (ATE) Across Different Conditions and Methods
### Overview
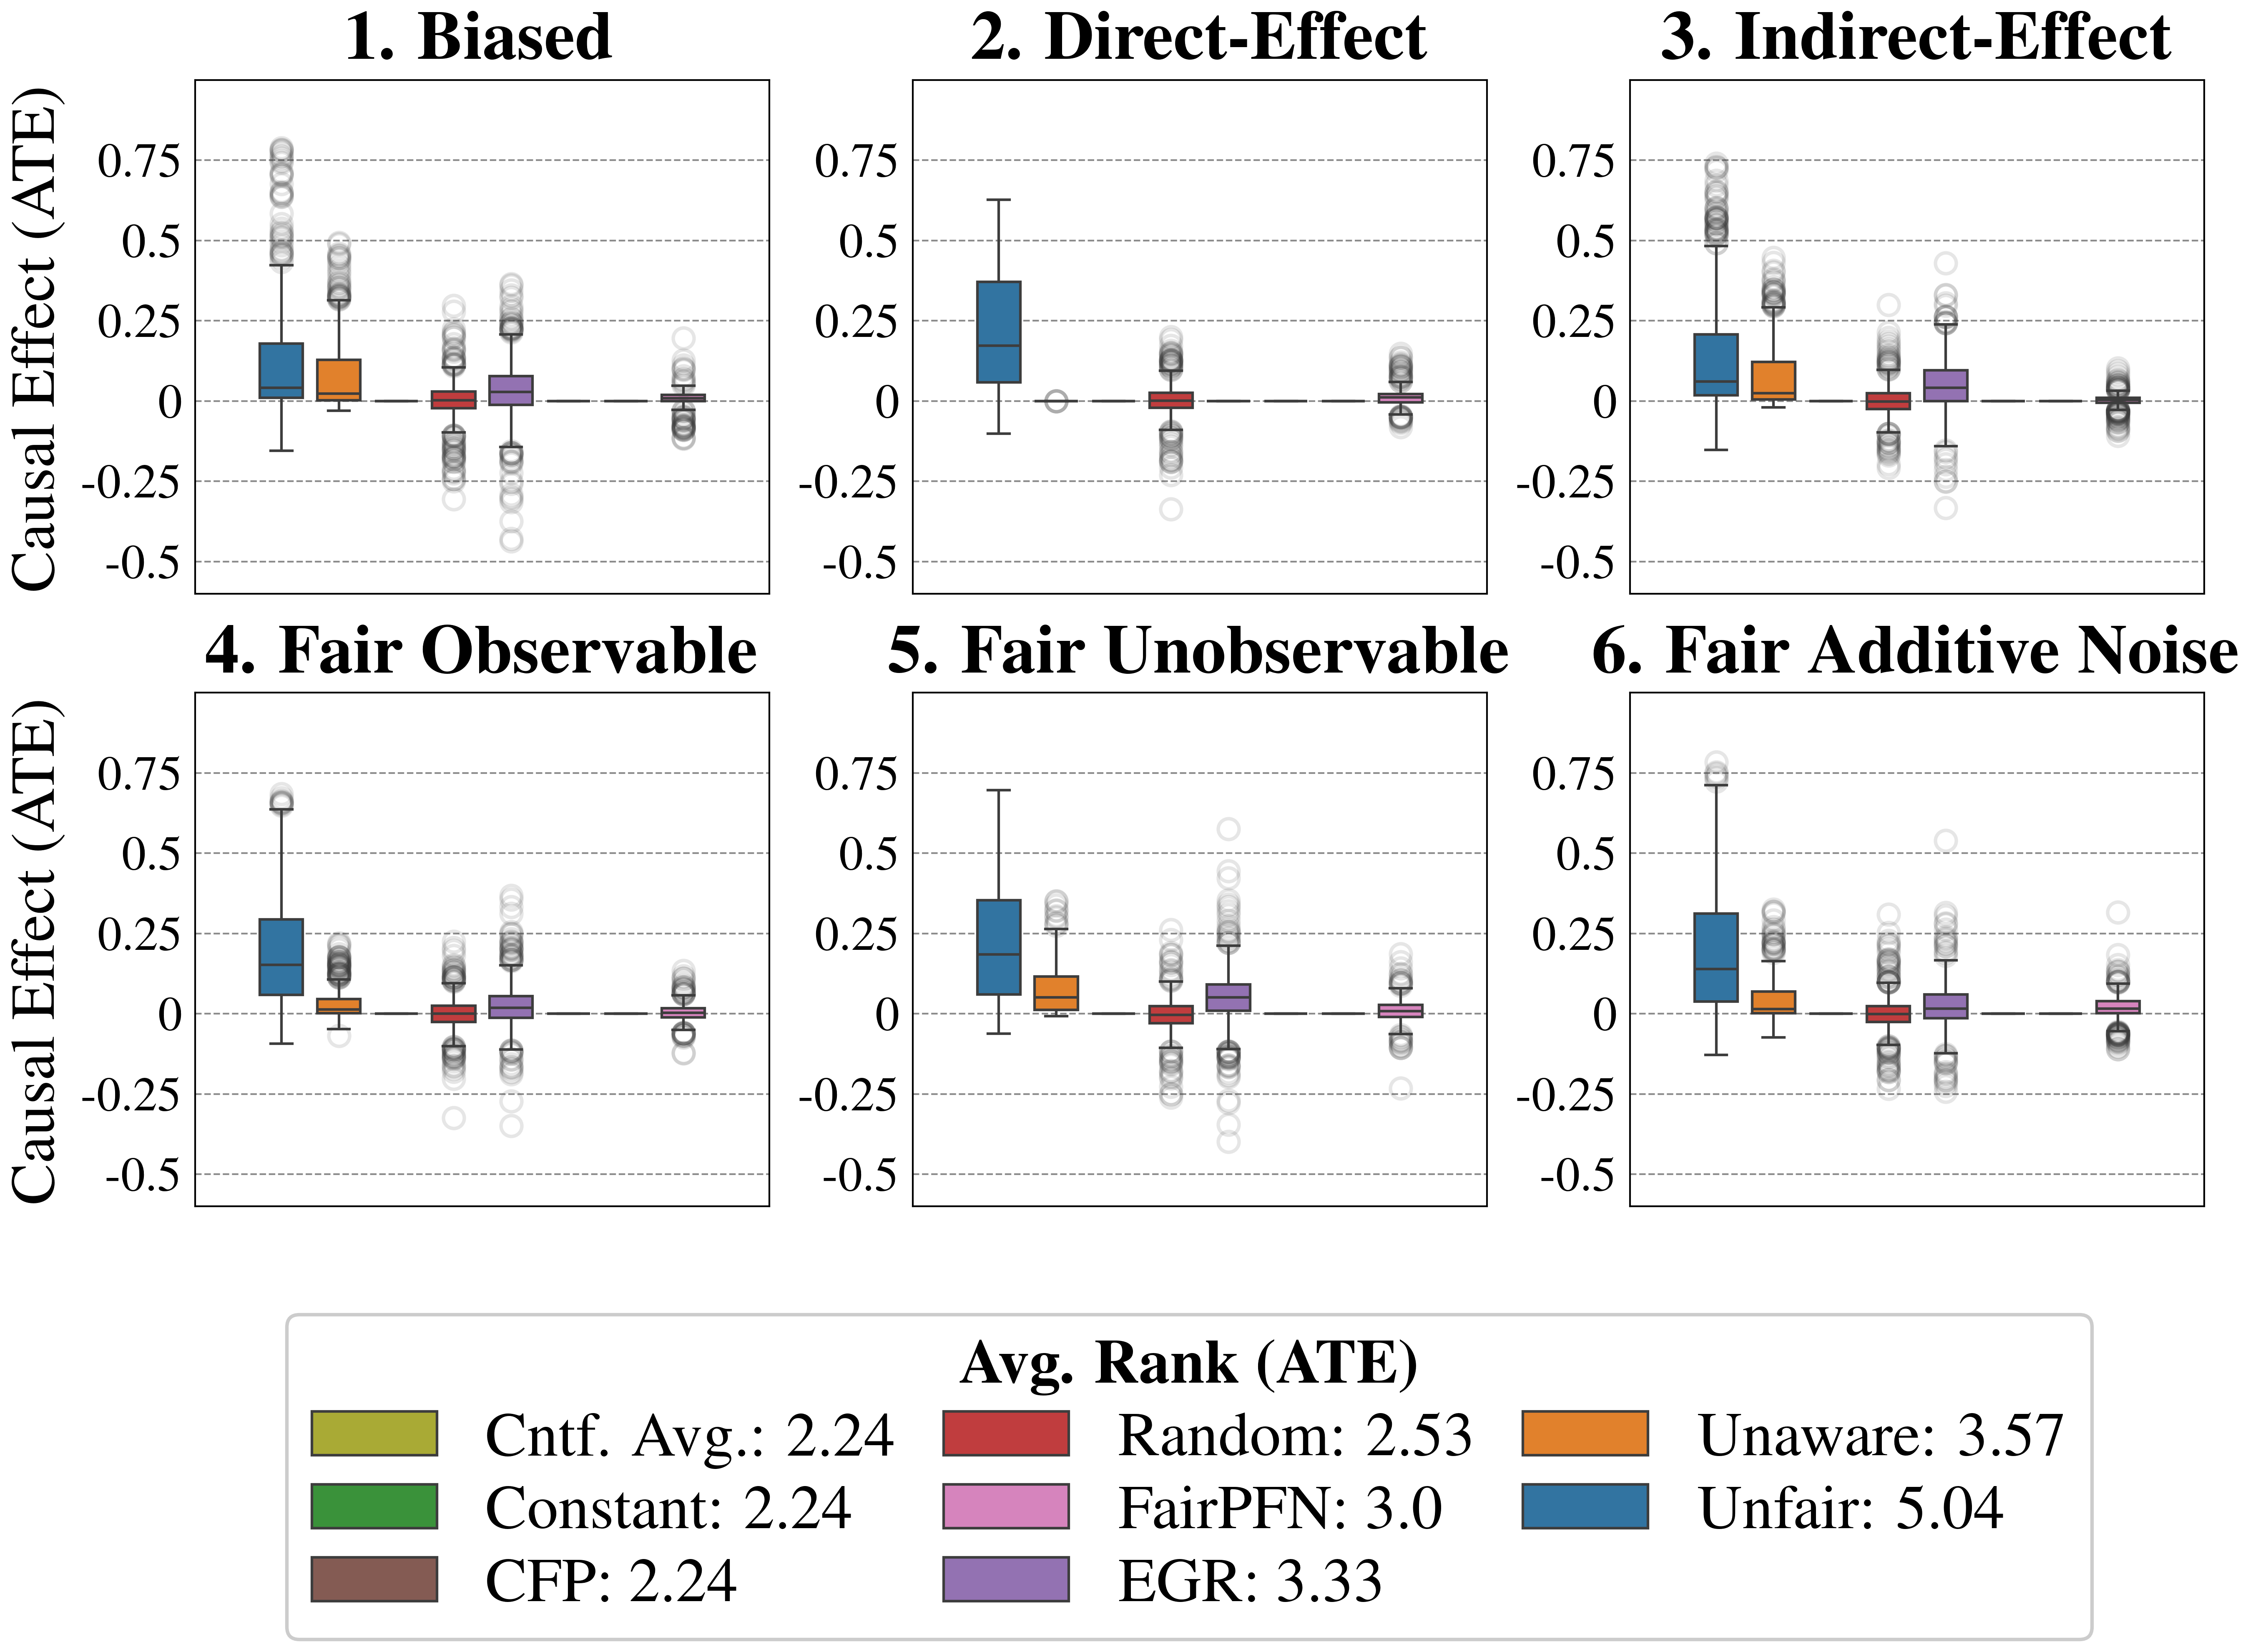
The image presents six box plots comparing the distribution of causal effect estimates (ATE) across six conditions: Biased, Direct-Effect, Indirect-Effect, Fair Observable, Fair Unobservable, and Fair Additive Noise. Each plot evaluates seven methods (Cntf. Avg., Random, Unaware, Constant, FairPFN, CFP, EGR) using a shared y-axis scale (-0.5 to 0.75). The legend at the bottom maps colors to methods, with average ranks (ATE) provided for each method.
### Components/Axes
- **Y-Axis**: "Causal Effect (ATE)" with values ranging from -0.5 to 0.75 in increments of 0.25.
- **X-Axis**: Six conditions (Biased, Direct-Effect, Indirect-Effect, Fair Observable, Fair Unobservable, Fair Additive Noise), each with a box plot for seven methods.
- **Legend**: Located at the bottom, mapping colors to methods:
- Cntf. Avg.: Green (Avg. Rank: 2.24)
- Constant: Dark Green (Avg. Rank: 2.24)
- CFP: Brown (Avg. Rank: 2.24)
- Random: Red (Avg. Rank: 2.53)
- Unaware: Orange (Avg. Rank: 3.57)
- FairPFN: Pink (Avg. Rank: 3.0)
- EGR: Purple (Avg. Rank: 3.33)
- **X-Axis Labels**: Positioned above each box plot, with method names listed in the legend.
### Detailed Analysis
1. **Biased Condition**:
- Highest variability in causal effects (widest interquartile ranges).
- Cntf. Avg., Constant, and CFP show near-zero medians with tight distributions.
- Unaware and EGR exhibit positive skews, with EGR reaching up to ~0.5.
2. **Direct-Effect Condition**:
- Cntf. Avg. and Constant dominate with near-zero medians.
- Random and Unaware show moderate positive effects (~0.2–0.3).
- EGR and FairPFN cluster near zero but with larger spreads.
3. **Indirect-Effect Condition**:
- Similar to Direct-Effect but with slightly higher variability.
- Unaware and EGR show positive effects (~0.1–0.2), while Cntf. Avg. and Constant remain near zero.
4. **Fair Observable**:
- Cntf. Avg., Constant, and CFP maintain near-zero medians.
- Random and Unaware show small positive effects (~0.1–0.2).
- EGR and FairPFN cluster near zero with minimal spread.
5. **Fair Unobservable**:
- Cntf. Avg. and Constant remain near zero.
- Random and Unaware show moderate positive effects (~0.2–0.3).
- EGR and FairPFN cluster near zero but with larger spreads.
6. **Fair Additive Noise**:
- Cntf. Avg. and Constant dominate with near-zero medians.
- Random and Unaware show small positive effects (~0.1–0.2).
- EGR and FairPFN cluster near zero with minimal spread.
### Key Observations
- **Bias Sensitivity**: The Biased condition exhibits the highest variability, suggesting methods struggle with uncorrected bias.
- **Method Performance**:
- **Cntf. Avg., Constant, CFP**: Consistently show the lowest average ranks (2.24) and tightest distributions, indicating robustness.
- **Unaware**: Highest average rank (3.57) and largest positive effects in Biased and Fair Unobservable conditions.
- **FairPFN and EGR**: Moderate performance (ranks 3.0–3.33) with variable effects across conditions.
- **Fair Conditions**: Observability and noise levels (Fair Observable, Fair Additive Noise) reduce variability compared to Biased, but method performance remains method-dependent.
### Interpretation
The data suggests that methods like Cntf. Avg., Constant, and CFP are most effective at estimating causal effects under bias, as evidenced by their low average ranks and near-zero medians. In contrast, the Unaware method performs poorly, particularly in biased scenarios, with inflated positive effects. The Fair conditions (Observable, Unobservable, Additive Noise) demonstrate that observability and noise levels influence causal effect estimates, but method choice remains critical. Notably, EGR and FairPFN show mixed performance, performing better in fair conditions but struggling with bias. The consistent dominance of Cntf. Avg., Constant, and CFP across conditions highlights their reliability in causal inference tasks.