## Bar Chart: Distribution of Generated Sub-questions per MetaQA Dataset
### Overview
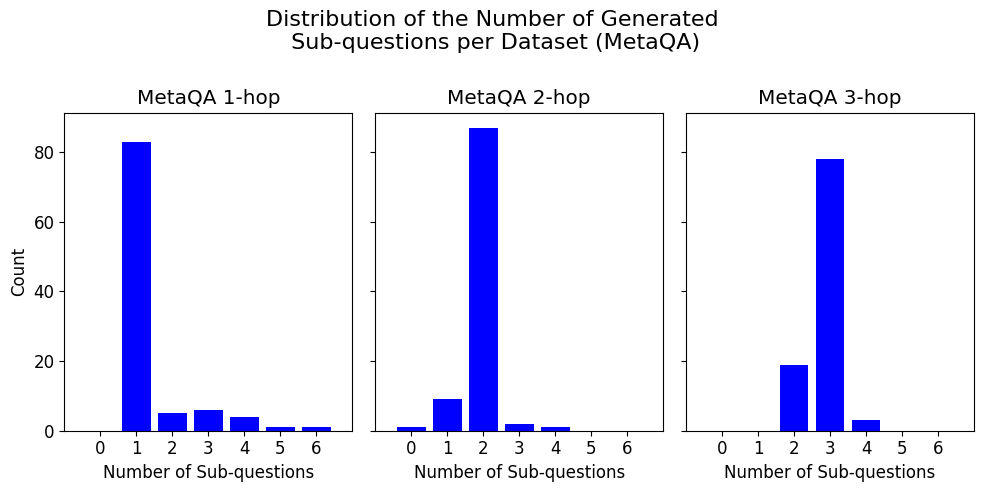
The image displays a set of three bar charts arranged horizontally, collectively titled "Distribution of the Number of Generated Sub-questions per Dataset (MetaQA)". Each chart represents a different subset of the MetaQA dataset, categorized by the number of reasoning "hops" required: 1-hop, 2-hop, and 3-hop. The charts show the frequency distribution of how many sub-questions were generated for questions within each subset.
### Components/Axes
* **Main Title:** "Distribution of the Number of Generated Sub-questions per Dataset (MetaQA)"
* **Subplot Titles (from left to right):**
* "MetaQA 1-hop"
* "MetaQA 2-hop"
* "MetaQA 3-hop"
* **X-Axis (All Subplots):** Labeled "Number of Sub-questions". The axis markers are integers from 0 to 6.
* **Y-Axis (Leftmost Subplot Only):** Labeled "Count". The axis markers are 0, 20, 40, 60, 80. The scale is consistent across all three subplots.
* **Data Series:** Each subplot contains a single data series represented by blue vertical bars. There is no separate legend, as the title of each subplot defines the data category.
### Detailed Analysis
**MetaQA 1-hop Chart (Left):**
* **Trend:** The distribution is heavily right-skewed, with a dominant peak at 1 sub-question and a long, low tail extending to higher numbers.
* **Data Points (Approximate Counts):**
* 0 sub-questions: ~0
* 1 sub-question: ~83
* 2 sub-questions: ~5
* 3 sub-questions: ~6
* 4 sub-questions: ~4
* 5 sub-questions: ~1
* 6 sub-questions: ~1
**MetaQA 2-hop Chart (Center):**
* **Trend:** The distribution is centered and peaked at 2 sub-questions, with smaller counts for 1 and 3, and very few for other values.
* **Data Points (Approximate Counts):**
* 0 sub-questions: ~1
* 1 sub-questions: ~9
* 2 sub-questions: ~87
* 3 sub-questions: ~2
* 4 sub-questions: ~1
* 5 sub-questions: ~0
* 6 sub-questions: ~0
**MetaQA 3-hop Chart (Right):**
* **Trend:** The distribution is centered and peaked at 3 sub-questions, with a notable secondary count at 2, and very few for other values.
* **Data Points (Approximate Counts):**
* 0 sub-questions: ~0
* 1 sub-questions: ~0
* 2 sub-questions: ~19
* 3 sub-questions: ~78
* 4 sub-questions: ~3
* 5 sub-questions: ~0
* 6 sub-questions: ~0
### Key Observations
1. **Clear Modal Shift:** The peak (mode) of the distribution shifts directly with the hop count: 1 sub-question for 1-hop, 2 for 2-hop, and 3 for 3-hop. This is the most prominent pattern.
2. **Distribution Shape:** All distributions are unimodal and right-skewed, but the skew is most extreme for the 1-hop dataset. The 2-hop and 3-hop distributions are more symmetric around their peaks.
3. **Low Variance for Higher Hops:** The 2-hop and 3-hop datasets show very little variance; the vast majority of questions are generated with exactly 2 or 3 sub-questions, respectively. The 1-hop dataset has a more noticeable tail.
4. **Presence of Zero:** A very small number of 2-hop questions appear to have been generated with 0 sub-questions, which is an outlier compared to the other datasets.
### Interpretation
The data strongly suggests a direct, near-linear relationship between the inherent complexity of a question (as defined by its "hop" count in the MetaQA dataset) and the number of sub-questions a model generates to answer it. This indicates the model's question decomposition strategy is well-calibrated to the dataset's structure.
* **1-hop questions** are treated as largely atomic, requiring only one sub-question in most cases (~83% of the time), with occasional minor decomposition.
* **2-hop and 3-hop questions** are systematically broken down into a number of sub-questions that closely matches their hop count. This implies the model is successfully identifying the necessary reasoning steps.
* The **outlier of 0 sub-questions for a 2-hop question** could indicate a failure case where the model attempted to answer directly without decomposition, or a data anomaly.
* The **secondary peak at 2 sub-questions for the 3-hop dataset** suggests that for some 3-hop questions, the model found a more efficient reasoning path requiring only two intermediate steps, or that the decomposition was not perfectly aligned with the ground-truth hops.
Overall, the charts demonstrate that the sub-question generation process is not random but is systematically influenced by the logical complexity of the input question, as defined by the MetaQA benchmark.