## Bar Charts: Distribution of Generated Sub-questions per Dataset (MetaQA)
### Overview
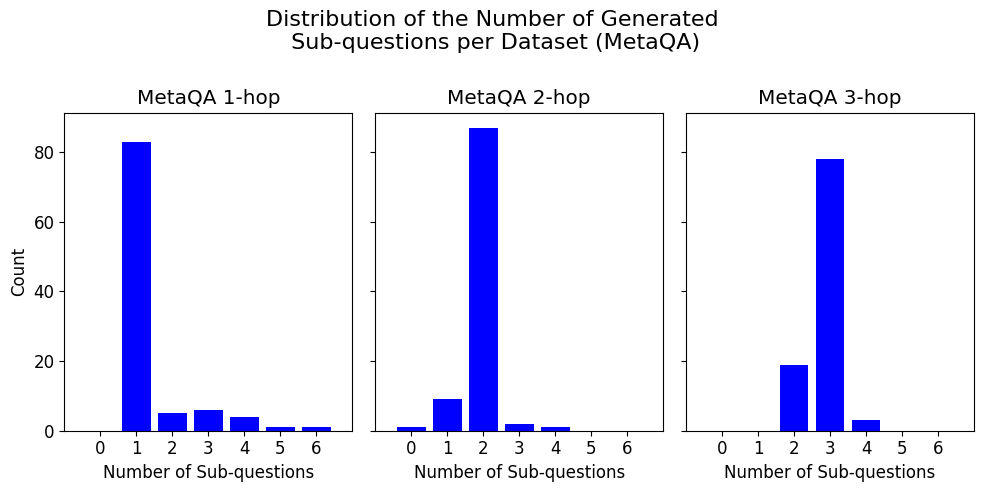
The image contains three bar charts comparing the distribution of generated sub-questions across three datasets labeled "MetaQA 1-hop," "MetaQA 2-hop," and "MetaQA 3-hop." Each chart visualizes the frequency of datasets generating a specific number of sub-questions (0–6), with counts on the y-axis (0–80).
### Components/Axes
- **X-axis**: "Number of Sub-questions" (categories: 0, 1, 2, 3, 4, 5, 6).
- **Y-axis**: "Count" (linear scale, 0–80 in increments of 20).
- **Legend**: No explicit legend is present. Each chart is labeled separately by hop count (1-hop, 2-hop, 3-hop).
- **Bar Colors**: All bars are blue, with no differentiation between datasets within individual charts.
### Detailed Analysis
#### MetaQA 1-hop
- **Trend**: Dominated by a single bar at 1 sub-question (~80 count).
- **Data Points**:
- 0 sub-questions: 0
- 1 sub-question: ~80
- 2 sub-questions: ~5
- 3 sub-questions: ~3
- 4 sub-questions: ~2
- 5 sub-questions: ~1
- 6 sub-questions: ~1
#### MetaQA 2-hop
- **Trend**: Peaks at 2 sub-questions (~85 count), with a secondary bar at 1 sub-question (~10 count).
- **Data Points**:
- 0 sub-questions: 0
- 1 sub-question: ~10
- 2 sub-questions: ~85
- 3 sub-questions: ~2
- 4 sub-questions: ~1
- 5 sub-questions: 0
- 6 sub-questions: 0
#### MetaQA 3-hop
- **Trend**: Peaks at 3 sub-questions (~75 count), with a secondary bar at 2 sub-questions (~20 count).
- **Data Points**:
- 0 sub-questions: 0
- 1 sub-question: 0
- 2 sub-questions: ~20
- 3 sub-questions: ~75
- 4 sub-questions: ~3
- 5 sub-questions: 0
- 6 sub-questions: 0
### Key Observations
1. **Peak Shift**: The optimal number of sub-questions increases with hop count (1 → 2 → 3).
2. **Decline in Frequency**: Counts drop sharply beyond the peak for each hop count.
3. **Sparsity**: Higher sub-question counts (4–6) are rare across all datasets.
### Interpretation
The data suggests that the complexity of the task (measured by hop count) directly influences the number of sub-questions generated. For 1-hop tasks, most datasets generate a single sub-question, likely reflecting straightforward decomposition. As hop count increases, the model generates more sub-questions to handle multi-step reasoning, peaking at 2 for 2-hop and 3 for 3-hop. The sharp decline in counts for higher sub-question numbers implies that generating excessive sub-questions is either inefficient or unsupported by the dataset structure. This pattern aligns with expectations for hierarchical question decomposition, where deeper reasoning requires more granular sub-questions but remains bounded by practical limits.