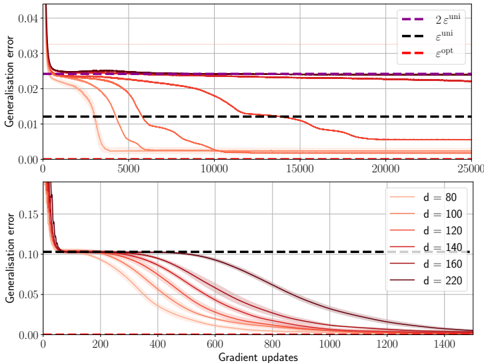
## Chart: Generalization Error vs. Gradient Updates
### Overview
The image presents two line charts illustrating the relationship between generalization error and gradient updates. The top chart compares three error metrics (e_uni, e_opt, and 2*e_uni) over 25,000 gradient updates. The bottom chart shows the generalization error for different values of 'd' (80, 100, 120, 140, 160, and 220) over 1400 gradient updates. Both charts share the same y-axis label: "Generalization error". The x-axis represents "Gradient updates".
### Components/Axes
* **Y-axis:** "Generalization error" - Scale ranges from approximately 0.00 to 0.04 in the top chart and 0.00 to 0.15 in the bottom chart.
* **X-axis:** "Gradient updates" - Top chart ranges from 0 to 25,000. Bottom chart ranges from 0 to 1400.
* **Top Chart Legend:**
* "2 * e_uni" (Purple line)
* "e_uni" (Black dashed line)
* "e_opt" (Red dashed line)
* **Bottom Chart Legend:**
* "d = 80" (Dark red line)
* "d = 100" (Red line)
* "d = 120" (Orange line)
* "d = 140" (Light orange line)
* "d = 160" (Brown line)
* "d = 220" (Black line)
### Detailed Analysis or Content Details
**Top Chart:**
* **2 * e_uni (Purple):** Starts at approximately 0.038, rapidly decreases to around 0.018 by gradient update 1000, and then plateaus around 0.016-0.017 for the remainder of the updates.
* **e_uni (Black dashed):** Starts at approximately 0.022, decreases more slowly than the purple line, reaching around 0.012 by gradient update 1000, and continues to decrease slowly, reaching approximately 0.010 by gradient update 25000.
* **e_opt (Red dashed):** Starts at approximately 0.015, decreases rapidly to around 0.005 by gradient update 1000, and continues to decrease slowly, reaching approximately 0.003 by gradient update 25000.
**Bottom Chart:**
* **d = 80 (Dark red):** Starts at approximately 0.14, rapidly decreases to around 0.01 by gradient update 400, and then plateaus around 0.008-0.01.
* **d = 100 (Red):** Starts at approximately 0.13, rapidly decreases to around 0.01 by gradient update 400, and then plateaus around 0.008-0.01.
* **d = 120 (Orange):** Starts at approximately 0.12, rapidly decreases to around 0.01 by gradient update 400, and then plateaus around 0.008-0.01.
* **d = 140 (Light orange):** Starts at approximately 0.11, rapidly decreases to around 0.01 by gradient update 400, and then plateaus around 0.008-0.01.
* **d = 160 (Brown):** Starts at approximately 0.10, rapidly decreases to around 0.01 by gradient update 400, and then plateaus around 0.008-0.01.
* **d = 220 (Black):** Starts at approximately 0.08, rapidly decreases to around 0.01 by gradient update 400, and then plateaus around 0.008-0.01.
### Key Observations
* In the top chart, `e_opt` consistently exhibits the lowest generalization error throughout the gradient updates.
* In the bottom chart, all lines converge to a similar generalization error level after approximately 400 gradient updates. The initial starting generalization error decreases as 'd' increases.
* The rate of decrease in generalization error is steepest in the initial stages of gradient updates for all lines in both charts.
* The bottom chart shows that larger values of 'd' start with lower generalization error, but the convergence rate is similar for all 'd' values.
### Interpretation
The charts demonstrate the convergence of generalization error during the training process, likely of a machine learning model. The top chart compares different error metrics, suggesting that `e_opt` provides the most optimistic estimate of the model's performance. The bottom chart explores the impact of the parameter 'd' on the generalization error. The fact that all lines converge to a similar error level suggests that, beyond a certain point, increasing 'd' does not significantly improve the model's generalization ability. The rapid initial decrease in error indicates that the model is quickly learning from the training data. The plateauing of the curves suggests that the model is approaching its optimal performance level. The consistent lower performance of `e_uni` compared to `e_opt` suggests a bias in the estimation of the error. The relationship between 'd' and initial error suggests that 'd' might be related to the model's capacity or complexity.