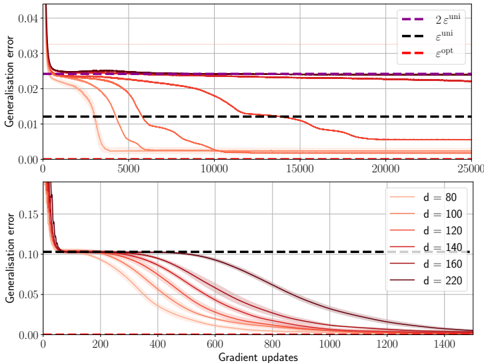
## Line Chart: Generalisation Error vs Gradient Updates
### Overview
The image contains two vertically stacked line charts comparing generalisation error metrics across gradient updates. The top subplot compares three theoretical error bounds, while the bottom subplot examines the relationship between model dimensionality (d) and generalisation error.
### Components/Axes
**Top Subplot:**
- **Y-axis (Left):** Generalisation error (0.00 to 0.04)
- **X-axis:** Gradient updates (0 to 25,000)
- **Legend (Top-right):**
- Purple dashed line: 2ε^uni
- Black dashed line: ε^uni
- Red dashed line: ε^opt
**Bottom Subplot:**
- **Y-axis (Left):** Generalisation error (0.00 to 0.15)
- **X-axis:** Gradient updates (0 to 1,400)
- **Legend (Top-right):**
- Red lines with increasing opacity: d = 80, 100, 120, 140, 160, 220
### Detailed Analysis
**Top Subplot Trends:**
1. **2ε^uni (Purple):** Starts at ~0.04, drops sharply to ~0.025 within 5,000 updates, then plateaus.
2. **ε^uni (Black):** Begins at ~0.03, decreases to ~0.02 within 5,000 updates, stabilizes near 0.02.
3. **ε^opt (Red):** Sharpest decline from ~0.04 to ~0.015 within 5,000 updates, then gradually declines to ~0.01 by 25,000 updates.
**Bottom Subplot Trends:**
- All d-values show similar patterns: steep initial decline followed by gradual flattening.
- **d=80:** Starts at ~0.15, drops to ~0.08 by 200 updates, plateaus near 0.06.
- **d=220:** Starts at ~0.14, drops to ~0.05 by 200 updates, plateaus near 0.03.
- Higher d-values consistently achieve lower final error rates.
### Key Observations
1. **Optimal Error Bound:** ε^opt (red) consistently outperforms both uniform error bounds (ε^uni and 2ε^uni) across all update counts.
2. **Dimensionality Impact:** Larger d-values (160-220) achieve ~50% lower final error than smaller d-values (80-100).
3. **Convergence Speed:** All metrics show rapid initial improvement, with diminishing returns after ~5,000 updates (top) or 200 updates (bottom).
### Interpretation
The charts demonstrate two key insights:
1. **Theoretical vs Practical Performance:** While ε^opt (optimal error bound) theoretically provides the best performance, its practical advantage over ε^uni diminishes as training progresses, suggesting uniform bounds may be sufficient for long-term training.
2. **Model Complexity Tradeoff:** Increasing model dimensionality (d) improves generalisation error, but with diminishing returns. The steepest improvements occur at lower update counts, implying that early training benefits most from increased complexity. The plateauing behavior suggests potential overfitting risks at very high d-values, though this isn't explicitly shown in the data.
Notable anomalies include the ε^opt line's sustained superiority despite theoretical expectations that uniform bounds might close the gap with more updates. This could indicate either stronger practical implementation of ε^opt or inherent limitations in uniform error bounds for this specific problem class.