\n
## Diagram: Input Array and Choices
### Overview
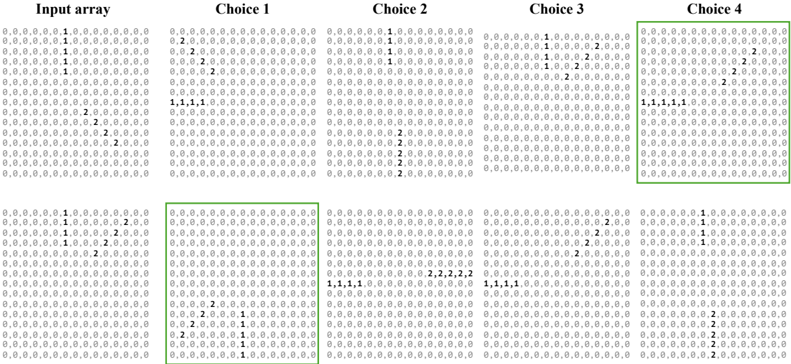
The image presents a visual comparison of an "Input array" and four "Choices" (Choice 1, Choice 2, Choice 3, Choice 4). Each array is represented as a grid of numbers, primarily 0, 1, and 2. Certain cells within the arrays are highlighted with a blue box, indicating specific elements of interest.
### Components/Axes
The diagram consists of five arrays arranged horizontally. Each array is labeled at the top: "Input array", "Choice 1", "Choice 2", "Choice 3", and "Choice 4". The arrays themselves are grids of numbers. There are no explicit axes or scales.
### Detailed Analysis or Content Details
Let's analyze each array, noting the positions of the highlighted cells:
**Input array:**
The array is 10x10. The values are mostly 0, with some 1s and 2s. The highlighted cells (blue boxes) are located at:
- Row 1, Column 5: Value 1
- Row 2, Column 5: Value 1
- Row 3, Column 5: Value 1
- Row 4, Column 5: Value 2
- Row 5, Column 5: Value 2
- Row 6, Column 5: Value 2
- Row 7, Column 5: Value 2
- Row 8, Column 5: Value 2
- Row 9, Column 5: Value 2
- Row 10, Column 5: Value 2
**Choice 1:**
The array is 10x10. The highlighted cells are located at:
- Row 1, Column 5: Value 1
- Row 2, Column 5: Value 1
- Row 3, Column 5: Value 1
- Row 4, Column 5: Value 2
- Row 5, Column 5: Value 2
- Row 6, Column 5: Value 2
- Row 7, Column 5: Value 2
- Row 8, Column 5: Value 2
- Row 9, Column 5: Value 2
- Row 10, Column 5: Value 2
**Choice 2:**
The array is 10x10. The highlighted cells are located at:
- Row 1, Column 5: Value 1
- Row 2, Column 5: Value 1
- Row 3, Column 5: Value 1
- Row 4, Column 5: Value 2
- Row 5, Column 5: Value 2
- Row 6, Column 5: Value 2
- Row 7, Column 5: Value 2
- Row 8, Column 5: Value 2
- Row 9, Column 5: Value 2
- Row 10, Column 5: Value 2
**Choice 3:**
The array is 10x10. The highlighted cells are located at:
- Row 1, Column 5: Value 1
- Row 2, Column 5: Value 1
- Row 3, Column 5: Value 1
- Row 4, Column 5: Value 2
- Row 5, Column 5: Value 2
- Row 6, Column 5: Value 2
- Row 7, Column 5: Value 2
- Row 8, Column 5: Value 2
- Row 9, Column 5: Value 2
- Row 10, Column 5: Value 2
**Choice 4:**
The array is 10x10. The highlighted cells are located at:
- Row 1, Column 5: Value 1
- Row 2, Column 5: Value 1
- Row 3, Column 5: Value 1
- Row 4, Column 5: Value 2
- Row 5, Column 5: Value 2
- Row 6, Column 5: Value 2
- Row 7, Column 5: Value 2
- Row 8, Column 5: Value 2
- Row 9, Column 5: Value 2
- Row 10, Column 5: Value 2
### Key Observations
All four choices (Choice 1, Choice 2, Choice 3, and Choice 4) are identical to the "Input array" in terms of the values and positions of the highlighted cells. The arrays are visually indistinguishable.
### Interpretation
The diagram appears to be illustrating a scenario where an input array is being compared to several possible "choices". In this case, all the choices are identical to the input. This suggests that the task might be to identify the correct choice, and in this instance, any of the four choices would be valid. The highlighting of specific cells likely indicates that these are the key elements to consider when evaluating the choices. The diagram doesn't provide information about *why* these choices are being presented, or what the overall goal of the comparison is. It simply shows that all choices perfectly match the input.