## Diagram: Array Transformation Comparison
### Overview
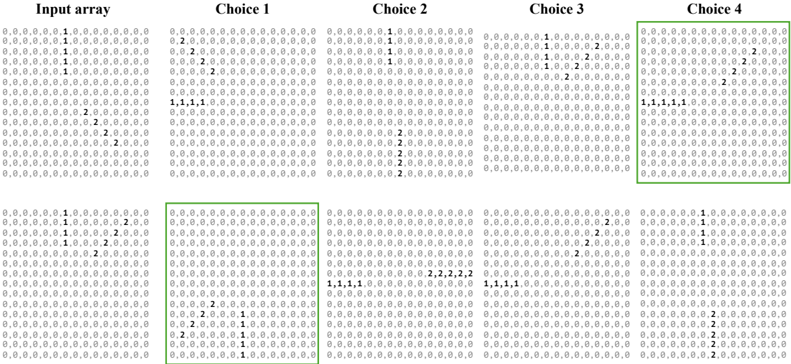
The image displays a technical comparison of ten 10x10 numerical arrays arranged in two rows of five. The first column in each row is labeled "Input array," serving as the source pattern. The subsequent four columns, labeled "Choice 1" through "Choice 4," present potential transformations or selections derived from the input. The primary visual distinction is the use of green highlighting (borders and cell backgrounds) to indicate a specific selection or correct answer within the "Choice" arrays.
### Components/Axes
* **Structure:** Two rows, each containing five distinct 10x10 grids.
* **Labels (Top Row, Left to Right):** "Input array", "Choice 1", "Choice 2", "Choice 3", "Choice 4".
* **Labels (Bottom Row, Left to Right):** "Input array", "Choice 1", "Choice 2", "Choice 3", "Choice 4".
* **Grid Content:** Each cell in the grids contains a single digit: 0, 1, or 2.
* **Highlighting:** A green border surrounds the entire grid of "Choice 4" in the top row and "Choice 1" in the bottom row. Within these highlighted grids, specific cells or clusters of cells also have a light green background fill.
### Detailed Analysis
**Top Row Analysis:**
* **Input array (Top-Left):** Contains a scattered pattern. Notable clusters: a vertical line of four '1's in column 2 (rows 1-4), a diagonal of '2's from (row 5, col 6) to (row 8, col 9), and a single '2' at (row 4, col 10).
* **Choice 1:** Shows a different scattered pattern. Contains a horizontal line of five '1's at the bottom (row 10, cols 1-5) and a diagonal of '2's from (row 3, col 3) to (row 6, col 6).
* **Choice 2:** Features a vertical line of five '2's in column 5 (rows 6-10) and a small cluster of '1's near the top (rows 1-3, cols 5-7).
* **Choice 3:** Has a diagonal line of '2's from (row 3, col 3) to (row 6, col 6) and a small cluster of '1's near the top-left (rows 2-3, cols 2-3).
* **Choice 4 (Highlighted):** The entire grid has a green border. It contains a dense, consolidated cluster of '1's in the bottom-left quadrant (approximately rows 7-10, cols 1-5). All other cells are '0'. This represents a significant spatial reorganization from the scattered input.
**Bottom Row Analysis:**
* **Input array (Bottom-Left):** Pattern differs from the top input. Has a vertical line of '1's in column 2 (rows 1-4), a diagonal of '2's from (row 3, col 8) to (row 6, col 5), and a cluster of '2's in the top-right (rows 1-3, cols 8-10).
* **Choice 1 (Highlighted):** The entire grid has a green border. It contains a dense, consolidated cluster of '2's in the bottom-left quadrant (approximately rows 7-10, cols 1-5) and a smaller cluster of '1's just above it (rows 5-6, cols 2-4). All other cells are '0'.
* **Choice 2:** Shows a horizontal line of five '1's at the bottom (row 10, cols 1-5) and a horizontal line of five '2's in the middle (row 6, cols 6-10).
* **Choice 3:** Contains a horizontal line of five '1's at the bottom (row 10, cols 1-5) and a diagonal of '2's from (row 3, col 8) to (row 6, col 5).
* **Choice 4:** Features a vertical line of '1's in column 5 (rows 1-4) and a vertical line of '2's in column 8 (rows 7-10).
### Key Observations
1. **Transformation Goal:** The highlighted choices (Top: Choice 4, Bottom: Choice 1) demonstrate a clear transformation rule: **consolidate all non-zero elements (1s and 2s) into a single, contiguous block in the bottom-left corner of the grid.** The spatial arrangement within the block (1s above 2s in the bottom example) may be significant.
2. **Pattern vs. Noise:** The non-highlighted choices (1, 2, 3 in the top row; 2, 3, 4 in the bottom row) present various other patterns (lines, diagonals, small clusters) but do not achieve the full consolidation seen in the highlighted answers.
3. **Input Variation:** The two "Input array" grids are different, suggesting the transformation rule must be applied to different starting configurations.
4. **Spatial Grounding:** The green border is a global indicator for the selected answer grid. The internal green cell highlighting in the top "Choice 4" is less prominent but appears to fill the background of the consolidated '1' cluster.
### Interpretation
This diagram likely illustrates a problem from a pattern recognition, algorithmic thinking, or machine learning test. The task is to identify the underlying rule governing the transformation from an "Input array" to a target state.
* **The Rule:** The correct transformation involves gathering all non-zero data points from their scattered positions in the input and packing them into a dense, organized block in a specific region (bottom-left) of the output grid. This is akin to a "defragmentation" or "compaction" operation applied to a 2D array.
* **Why It Matters:** This type of problem tests spatial reasoning, the ability to discern a consistent rule from examples, and understanding of data reorganization principles. It could model concepts like data compression, image processing (pixel clustering), or optimization where scattered resources are consolidated.
* **Notable Anomaly:** The internal ordering of numbers within the consolidated block (1s above 2s in the bottom example) suggests the rule may also involve sorting or prioritizing the non-zero values during consolidation, not just spatial grouping.
* **Peircean Investigation:** The evidence (two input-output pairs) points to a **rule of spatial compaction with possible value-based ordering**. The "Choice" options act as hypotheses, with the highlighted ones being the only ones that satisfy the inferred rule of creating a single, dense cluster in the bottom-left corner. The other choices represent plausible but incorrect hypotheses (e.g., forming lines or maintaining original relative positions).