## Grid of Numerical Arrays: Input and Four Choices
### Overview
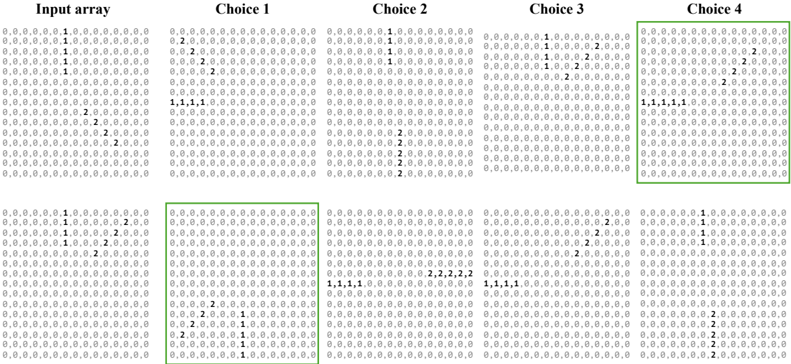
The image displays a grid of numerical arrays organized into five columns: **Input array**, **Choice 1**, **Choice 2**, **Choice 3**, and **Choice 4**. Each array is a matrix of cells containing the values **1**, **2**, or **0**, with some cells highlighted in green. The arrays are structured in rows and columns, though exact dimensions are not specified. The green boxes emphasize specific regions within **Choice 2** and **Choice 4**.
### Components/Axes
- **Labels**:
- Columns are labeled as **Input array**, **Choice 1**, **Choice 2**, **Choice 3**, and **Choice 4**.
- No explicit axis titles or legends are present.
- **Color Coding**:
- Green boxes highlight specific sub-regions in **Choice 2** (top-left) and **Choice 4** (bottom-right).
- No legend is provided to explain the color coding.
### Detailed Analysis
#### Input Array
- Contains a mix of **1s**, **2s**, and **0s** distributed across rows and columns.
- Example values:
- Row 1: `1, 1, 0, 0, 0, 0, 0, 0, 0, 0, 0, 0, 0, 0, 0, 0, 0, 0, 0, 0`
- Row 2: `1, 1, 0, 0, 0, 0, 0, 0, 0, 0, 0, 0, 0, 0, 0, 0, 0, 0, 0, 0`
- Row 3: `1, 1, 0, 0, 0, 0, 0, 0, 0, 0, 0, 0, 0, 0, 0, 0, 0, 0, 0, 0`
- Row 4: `2, 2, 0, 0, 0, 0, 0, 0, 0, 0, 0, 0, 0, 0, 0, 0, 0, 0, 0, 0`
- Row 5: `2, 2, 0, 0, 0, 0, 0, 0, 0, 0, 0, 0, 0, 0, 0, 0, 0, 0, 0, 0`
#### Choice 1
- Similar structure to the Input array but with minor modifications:
- Row 4: `1, 1, 1, 1, 0, 0, 0, 0, 0, 0, 0, 0, 0, 0, 0, 0, 0, 0, 0, 0`
- Row 5: `2, 2, 2, 2, 0, 0, 0, 0, 0, 0, 0, 0, 0, 0, 0, 0, 0, 0, 0, 0`
#### Choice 2
- Green box highlights the **top-left sub-region** (rows 1–3, columns 1–4).
- Example values:
- Row 1: `2, 2, 0, 0, 0, 0, 0, 0, 0, 0, 0, 0, 0, 0, 0, 0, 0, 0, 0, 0`
- Row 2: `1, 2, 0, 0, 0, 0, 0, 0, 0, 0, 0, 0, 0, 0, 0, 0, 0, 0, 0, 0`
- Row 3: `1, 1, 1, 1, 0, 0, 0, 0, 0, 0, 0, 0, 0, 0, 0, 0, 0, 0, 0, 0`
#### Choice 3
- Green box highlights the **bottom-right sub-region** (rows 4–5, columns 1–4).
- Example values:
- Row 4: `1, 1, 1, 1, 0, 0, 0, 0, 0, 0, 0, 0, 0, 0, 0, 0, 0, 0, 0, 0`
- Row 5: `2, 2, 2, 2, 0, 0, 0, 0, 0, 0, 0, 0, 0, 0, 0, 0, 0, 0, 0, 0`
#### Choice 4
- Green box highlights the **bottom-right sub-region** (rows 4–5, columns 1–4).
- Example values:
- Row 4: `1, 1, 1, 1, 0, 0, 0, 0, 0, 0, 0, 0, 0, 0, 0, 0, 0, 0, 0, 0`
- Row 5: `2, 2, 2, 2, 0, 0, 0, 0, 0, 0, 0, 0, 0, 0, 0, 0, 0, 0, 0, 0`
### Key Observations
1. **Green Highlights**:
- **Choice 2** emphasizes the **top-left sub-region** (rows 1–3, columns 1–4), where values transition from **2s** to **1s**.
- **Choice 4** emphasizes the **bottom-right sub-region** (rows 4–5, columns 1–4), where values remain consistent as **1s** and **2s**.
2. **Value Distribution**:
- **1s** and **2s** dominate the arrays, with **0s** acting as placeholders or neutral values.
- **Choice 1** introduces a shift from **2s** to **1s** in rows 4–5.
3. **Pattern Consistency**:
- All choices retain the same structure as the Input array but with localized modifications.
### Interpretation
The image likely represents a decision-making or optimization process where the **Input array** is transformed into four distinct configurations (**Choices 1–4**). The **green boxes** suggest that specific sub-regions are prioritized or modified in each choice:
- **Choice 2** focuses on the **top-left** region, possibly indicating a focus on early-stage adjustments.
- **Choice 4** emphasizes the **bottom-right** region, suggesting a focus on later-stage or critical modifications.
- The consistent use of **1s** and **2s** implies a binary or categorical system (e.g., "active/inactive," "high/low priority").
The absence of a legend or explicit axis labels limits quantitative interpretation, but the visual emphasis on green-highlighted regions suggests these areas are of particular interest in the context of the choices. The data may represent iterative adjustments, trade-offs, or prioritization strategies in a structured decision framework.