## Box Plot: NSGA-II with N=n+1 on LOTZ
### Overview
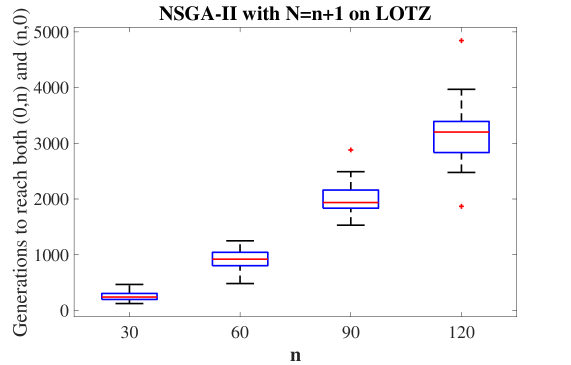
The image is a box plot visualizing the distribution of generations required for the NSGA-II optimization algorithm (with N=n+1) to reach both (0,n) and (n,0) on the LOTZ problem. The x-axis represents the parameter `n` (30, 60, 90, 120), and the y-axis represents the number of generations (0 to 5000). Red plus signs denote outliers, while blue boxes with red medians represent the interquartile ranges.
### Components/Axes
- **Title**: "NSGA-II with N=n+1 on LOTZ" (centered at the top).
- **X-axis**: Labeled "n" with categories 30, 60, 90, 120 (bottom axis).
- **Y-axis**: Labeled "Generations to reach both (0,n) and (n,0)" (left axis), scaled from 0 to 5000.
- **Legend**: Located in the top-right corner, with:
- **Blue**: Median (red line inside boxes).
- **Red**: Outliers (red plus signs).
### Detailed Analysis
- **n=30**:
- Median: ~200 generations (red line).
- IQR: ~100–300 generations.
- Outliers: ~300 and ~400 generations (red plus signs).
- **n=60**:
- Median: ~900 generations.
- IQR: ~700–1100 generations.
- Outliers: ~1200 and ~1500 generations.
- **n=90**:
- Median: ~2000 generations.
- IQR: ~1600–2400 generations.
- Outliers: ~2500 and ~3000 generations.
- **n=120**:
- Median: ~3200 generations.
- IQR: ~2600–3800 generations.
- Outliers: ~3800 and ~4800 generations.
### Key Observations
1. **Trend**: As `n` increases, the median number of generations required grows exponentially (e.g., from ~200 for n=30 to ~3200 for n=120).
2. **Spread**: The interquartile range (IQR) widens significantly with larger `n`, indicating greater variability in performance.
3. **Outliers**: Outliers become more frequent and extreme at higher `n` values, suggesting rare but extreme cases where the algorithm takes much longer to converge.
### Interpretation
The data demonstrates that the NSGA-II algorithm's performance degrades as the problem size (`n`) increases. The exponential rise in median generations aligns with the computational complexity of optimization problems, where larger search spaces require more iterations. The increasing IQR and outliers highlight the algorithm's sensitivity to problem configuration, with some instances (e.g., n=120) requiring nearly 5000 generations. This suggests that while NSGA-II is effective for smaller `n`, its efficiency diminishes for larger-scale problems, potentially necessitating hybrid approaches or parameter tuning for practical applications.