## Box Plot: NSGA-II with N=n+1 on LOTZ
### Overview
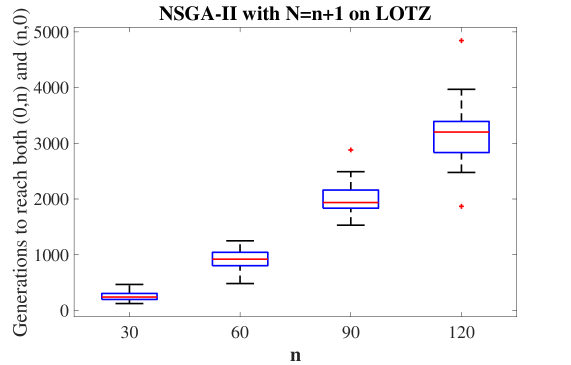
The image is a box plot showing the number of generations required for the NSGA-II algorithm (with N=n+1) to reach both (0,n) and (n,0) on the LOTZ problem. The x-axis represents the value of 'n', and the y-axis represents the number of generations. The plot displays the distribution of generations for different values of 'n' (30, 60, 90, and 120) using box-and-whisker plots.
### Components/Axes
* **Title:** NSGA-II with N=n+1 on LOTZ
* **X-axis:**
* Label: n
* Values: 30, 60, 90, 120
* **Y-axis:**
* Label: Generations to reach both (0,n) and (n,0)
* Scale: 0 to 5000
* **Box Plot Elements:** Each box plot consists of:
* A box representing the interquartile range (IQR).
* A red line within the box indicating the median.
* Whiskers extending from the box to show the range of the data.
* Red '+' symbols indicating outliers.
### Detailed Analysis
The box plots show the distribution of the number of generations required for different values of 'n'.
* **n = 30:**
* Median: Approximately 250
* IQR: Approximately 150 to 350
* Range: Approximately 100 to 500
* **n = 60:**
* Median: Approximately 900
* IQR: Approximately 750 to 1100
* Range: Approximately 500 to 1300
* **n = 90:**
* Median: Approximately 2000
* IQR: Approximately 1700 to 2300
* Range: Approximately 1500 to 2900. One outlier at approximately 2900.
* **n = 120:**
* Median: Approximately 3200
* IQR: Approximately 2800 to 3500
* Range: Approximately 2500 to 4000. Two outliers, one at approximately 1900 and another at approximately 4900.
### Key Observations
* The number of generations required increases as 'n' increases.
* The spread (IQR and range) of the data also increases with 'n', indicating greater variability in the number of generations required.
* Outliers are present for n=90 and n=120, suggesting that in some runs, the algorithm took significantly more or less generations to converge.
### Interpretation
The box plot demonstrates that the number of generations required for the NSGA-II algorithm to reach both (0,n) and (n,0) on the LOTZ problem increases as the value of 'n' increases. This suggests that the problem becomes more difficult to solve as 'n' increases, requiring more generations for the algorithm to converge. The increasing spread of the data indicates that the performance of the algorithm becomes more variable as 'n' increases. The presence of outliers suggests that there are specific instances where the algorithm performs significantly better or worse than average.