\n
## Box Plot: NSGA-II Performance on LOTZ
### Overview
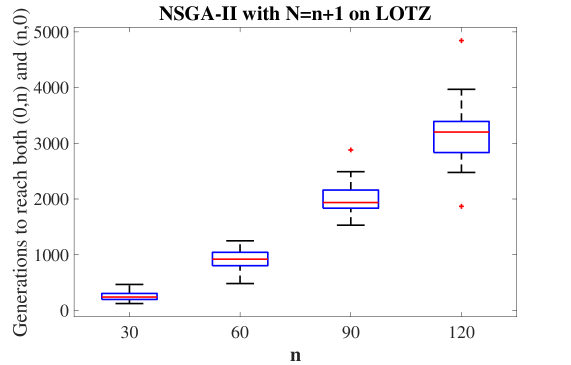
The image presents a series of box plots illustrating the relationship between the parameter 'n' and the number of generations required to reach both (0,n) and (n,0) using the NSGA-II algorithm on the LOTZ problem. The x-axis represents the values of 'n', and the y-axis represents the number of generations.
### Components/Axes
* **Title:** "NSGA-II with N=n+1 on LOTZ" - positioned at the top-center of the image.
* **X-axis Label:** "n" - positioned at the bottom-center of the image. The axis has markers at 30, 60, 90, and 120.
* **Y-axis Label:** "Generations to reach both (0,n) and (n,0)" - positioned on the left-center of the image. The axis ranges from approximately 0 to 5000, with tick marks at intervals of 1000.
* **Data Series:** Four box plots, each corresponding to a different value of 'n' (30, 60, 90, 120). The box plots are colored in shades of blue and red.
* **Outliers:** Represented by '+' symbols.
### Detailed Analysis
The box plots show the distribution of generations required for each value of 'n'.
* **n = 30 (Blue):** The box plot is centered around approximately 300 generations. The box extends from roughly 200 to 500 generations. There are no visible outliers.
* **n = 60 (Blue):** The box plot is centered around approximately 800 generations. The box extends from roughly 600 to 1100 generations. There are no visible outliers.
* **n = 90 (Red):** The box plot is centered around approximately 1800 generations. The box extends from roughly 1400 to 2200 generations. There is one outlier at approximately 2500 generations.
* **n = 120 (Red):** The box plot is centered around approximately 3000 generations. The box extends from roughly 2400 to 3600 generations. There are two outliers, one at approximately 4800 generations and another at approximately 2200 generations.
The trend is that as 'n' increases, the median number of generations required to reach both (0,n) and (n,0) also increases. The spread of the data (as indicated by the box size) also appears to increase with 'n'.
### Key Observations
* There is a clear positive correlation between 'n' and the number of generations required.
* The variability in the number of generations increases with 'n'.
* Outliers become more frequent and more extreme as 'n' increases.
* The color of the box plots changes from blue to red as 'n' increases, potentially indicating a shift in the algorithm's behavior or performance characteristics.
### Interpretation
The data suggests that the NSGA-II algorithm's performance on the LOTZ problem degrades as the parameter 'n' increases. Specifically, it takes significantly more generations to converge to a solution where both (0,n) and (n,0) are reached. The increasing variability suggests that the problem becomes more complex and less predictable as 'n' grows. The outliers indicate that, for larger values of 'n', there are instances where the algorithm requires a substantially larger number of generations to converge.
The change in box plot color from blue to red could be a visual cue indicating a change in the algorithm's behavior or a different set of parameters being used for larger values of 'n'. Further investigation would be needed to determine the reason for this color change.
The LOTZ problem, combined with the NSGA-II algorithm, appears to exhibit a scaling issue where the computational cost increases rapidly with the problem size (represented by 'n'). This could be due to the increased search space or the difficulty of finding optimal solutions in higher dimensions.