\n
## 3D Anatomical Visualization: Fetal Model with Data Point Overlay
### Overview
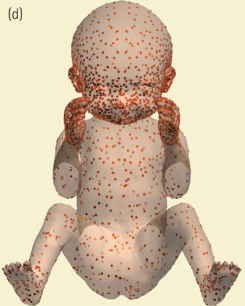
The image displays a three-dimensional, semi-transparent rendering of a human fetus or infant in a seated, cross-legged position. The model is overlaid with a dense distribution of small, colored dots (markers) across its entire surface. The label "(d)" in the top-left corner indicates this is likely panel (d) from a multi-part figure in a scientific or technical document. The background is a uniform, pale yellowish-beige.
### Components/Axes
* **Primary Subject:** A 3D anatomical model of a human fetus/infant. The model is rendered with a smooth, semi-transparent, skin-toned surface, allowing internal shadows and some underlying structure to be faintly visible.
* **Data Overlay:** Hundreds of small, circular dots are distributed across the model's surface. These dots vary in color from a bright orange to a dark brown/black.
* **Label:** The text "(d)" is positioned in the upper-left corner of the image frame.
* **Axes/Legend:** There are **no** visible axes, scales, titles, or legends within the image frame. The meaning of the dot colors and their distribution is not explained by any on-image key.
### Detailed Analysis
* **Dot Distribution:** The dots are not uniformly distributed. There is a notably high concentration on the following areas:
* The scalp and face, particularly around the eyes, nose, and mouth.
* The hands and fingers, which are held up near the face.
* The feet and toes.
* The knees and elbows.
* The chest and abdominal regions show a more moderate, scattered distribution.
* **Dot Color Gradient:** The dots exhibit a color gradient. The brightest orange dots appear most frequently on the torso and limbs. The darkest (brown/black) dots are most densely clustered on the face, hands, and feet. This suggests a potential data gradient where color intensity correlates with a measured value (e.g., gene expression level, cell density, signal intensity).
* **Spatial Grounding:** The highest density of the darkest markers is located in the **center** of the image (the face and hands). The **peripheral** areas (limbs, torso) show a mix of colors with a lower overall density compared to the central facial region.
### Key Observations
1. **Non-Random Pattern:** The distribution of markers is highly non-random, clustering in specific anatomical regions, which implies the visualization is mapping a biological or physical phenomenon tied to those areas.
2. **Color-Density Correlation:** Regions with the highest density of markers (face, hands, feet) also tend to have the darkest-colored markers, suggesting a correlation between the quantity of the measured phenomenon and its intensity/value.
3. **Anatomical Fidelity:** The model includes detailed features like individual fingers and toes, and the markers respect these boundaries, indicating a high-resolution mapping.
4. **Lack of Explanatory Context:** The image is devoid of a title, legend, or axis labels, making it impossible to definitively state what the dots represent without the accompanying figure caption or main text of the source document.
### Interpretation
This image is a **spatial data visualization** overlaid on a 3D anatomical template. It is designed to show the **geographic distribution and relative intensity** of a measured variable across the surface of a developing human body.
* **What it Demonstrates:** The data suggests the measured phenomenon (e.g., gene expression, protein concentration, neural activity, biophysical property) is not uniform. It is **upregulated or concentrated** in regions critical for early sensory and motor development: the face (sensory input), hands and feet (tactile exploration and motor development), and major joints.
* **Relationship Between Elements:** The 3D model provides the essential anatomical context. The colored dots are the data layer. Their placement and color create a "heat map" on the body's surface, transforming abstract numerical data into an intuitive spatial pattern.
* **Notable Anomalies/Patterns:** The most striking pattern is the **intense clustering on the facial perioral region and the hands**. In a developmental context, this could correlate with areas of high innervation, stem cell activity, or regions that are functionally significant for survival (sucking, grasping). The relative sparsity on the back and posterior skull is also notable.
* **Peircean Investigation:** The image functions as an **index** (the dots physically point to locations on the body) and a **symbol** (the color gradient symbolically represents a quantitative scale). A viewer can infer that "darker/more dots = more of something," but the "something" remains unknown without the symbolic key (legend). The power of the image lies in making an abstract dataset **visceral and anatomically grounded**, allowing researchers to spot correlations between data and morphology that might be missed in a table or 2D graph.
**Language Declaration:** The only text present is the label "(d)", which is a standard alphanumeric figure panel identifier. No other language is present in the image.