## Bar Chart: Comparison of Categories
### Overview
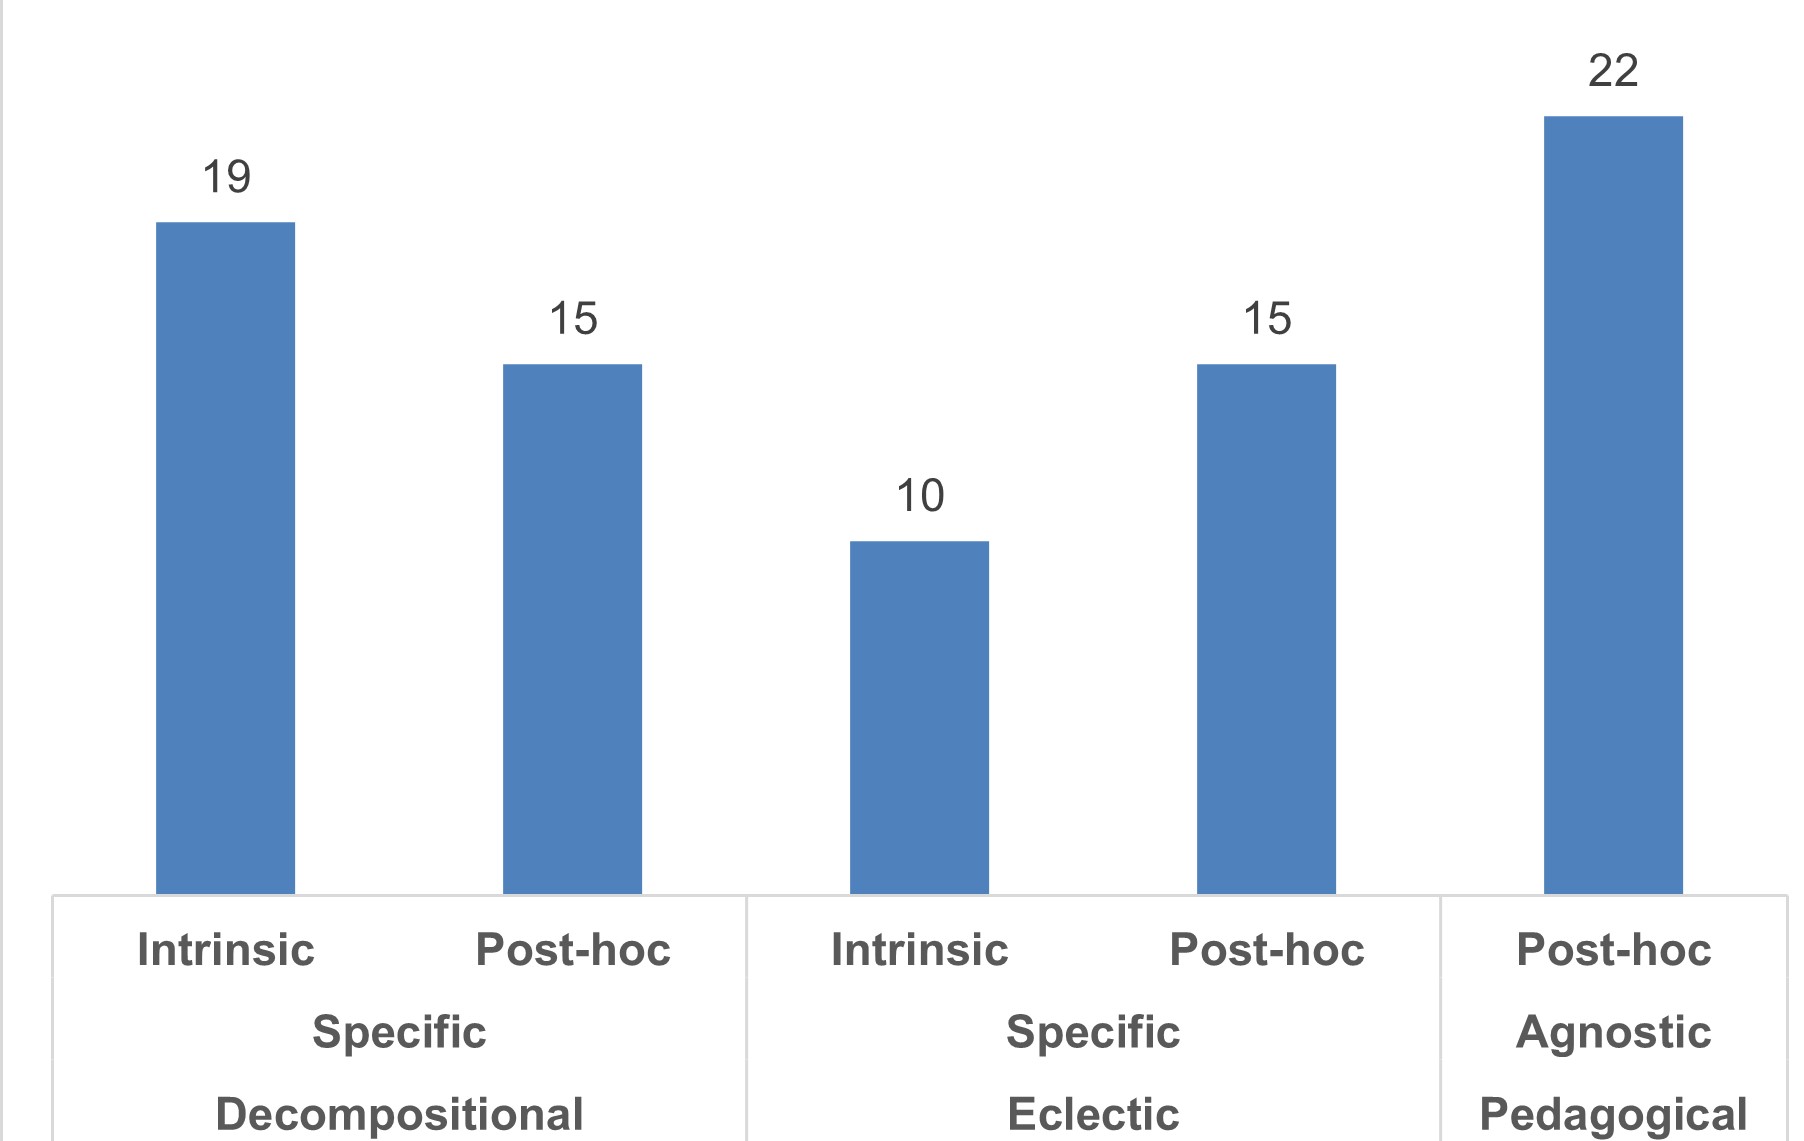
The image is a bar chart comparing different categories. The chart displays five categories along the x-axis, each represented by a blue bar. The y-axis is not explicitly labeled but represents a numerical value indicated above each bar.
### Components/Axes
* **X-axis Labels (Categories):**
* "Intrinsic Specific Decompositional"
* "Post-hoc Specific Decompositional"
* "Intrinsic Specific Eclectic"
* "Post-hoc Specific Eclectic"
* "Post-hoc Agnostic Pedagogical"
* **Y-axis:** The y-axis is not explicitly labeled, but the values are represented by the height of the bars, with numerical values displayed above each bar.
* **Bar Color:** All bars are blue.
### Detailed Analysis
* **Intrinsic Specific Decompositional:** The bar has a value of 19.
* **Post-hoc Specific Decompositional:** The bar has a value of 15.
* **Intrinsic Specific Eclectic:** The bar has a value of 10.
* **Post-hoc Specific Eclectic:** The bar has a value of 15.
* **Post-hoc Agnostic Pedagogical:** The bar has a value of 22.
### Key Observations
* The "Post-hoc Agnostic Pedagogical" category has the highest value (22).
* The "Intrinsic Specific Eclectic" category has the lowest value (10).
* "Post-hoc Specific Decompositional" and "Post-hoc Specific Eclectic" have the same value (15).
### Interpretation
The bar chart provides a comparison of different categories, likely representing some form of measurement or count. The "Post-hoc Agnostic Pedagogical" category stands out as having the highest value, suggesting it is the most prevalent or significant among the categories being compared. The "Intrinsic Specific Eclectic" category has the lowest value, indicating it is the least prevalent or significant. The chart allows for a quick visual comparison of the relative magnitudes of each category.