\n
## Bar Chart: Comparison of Values Across Categories
### Overview
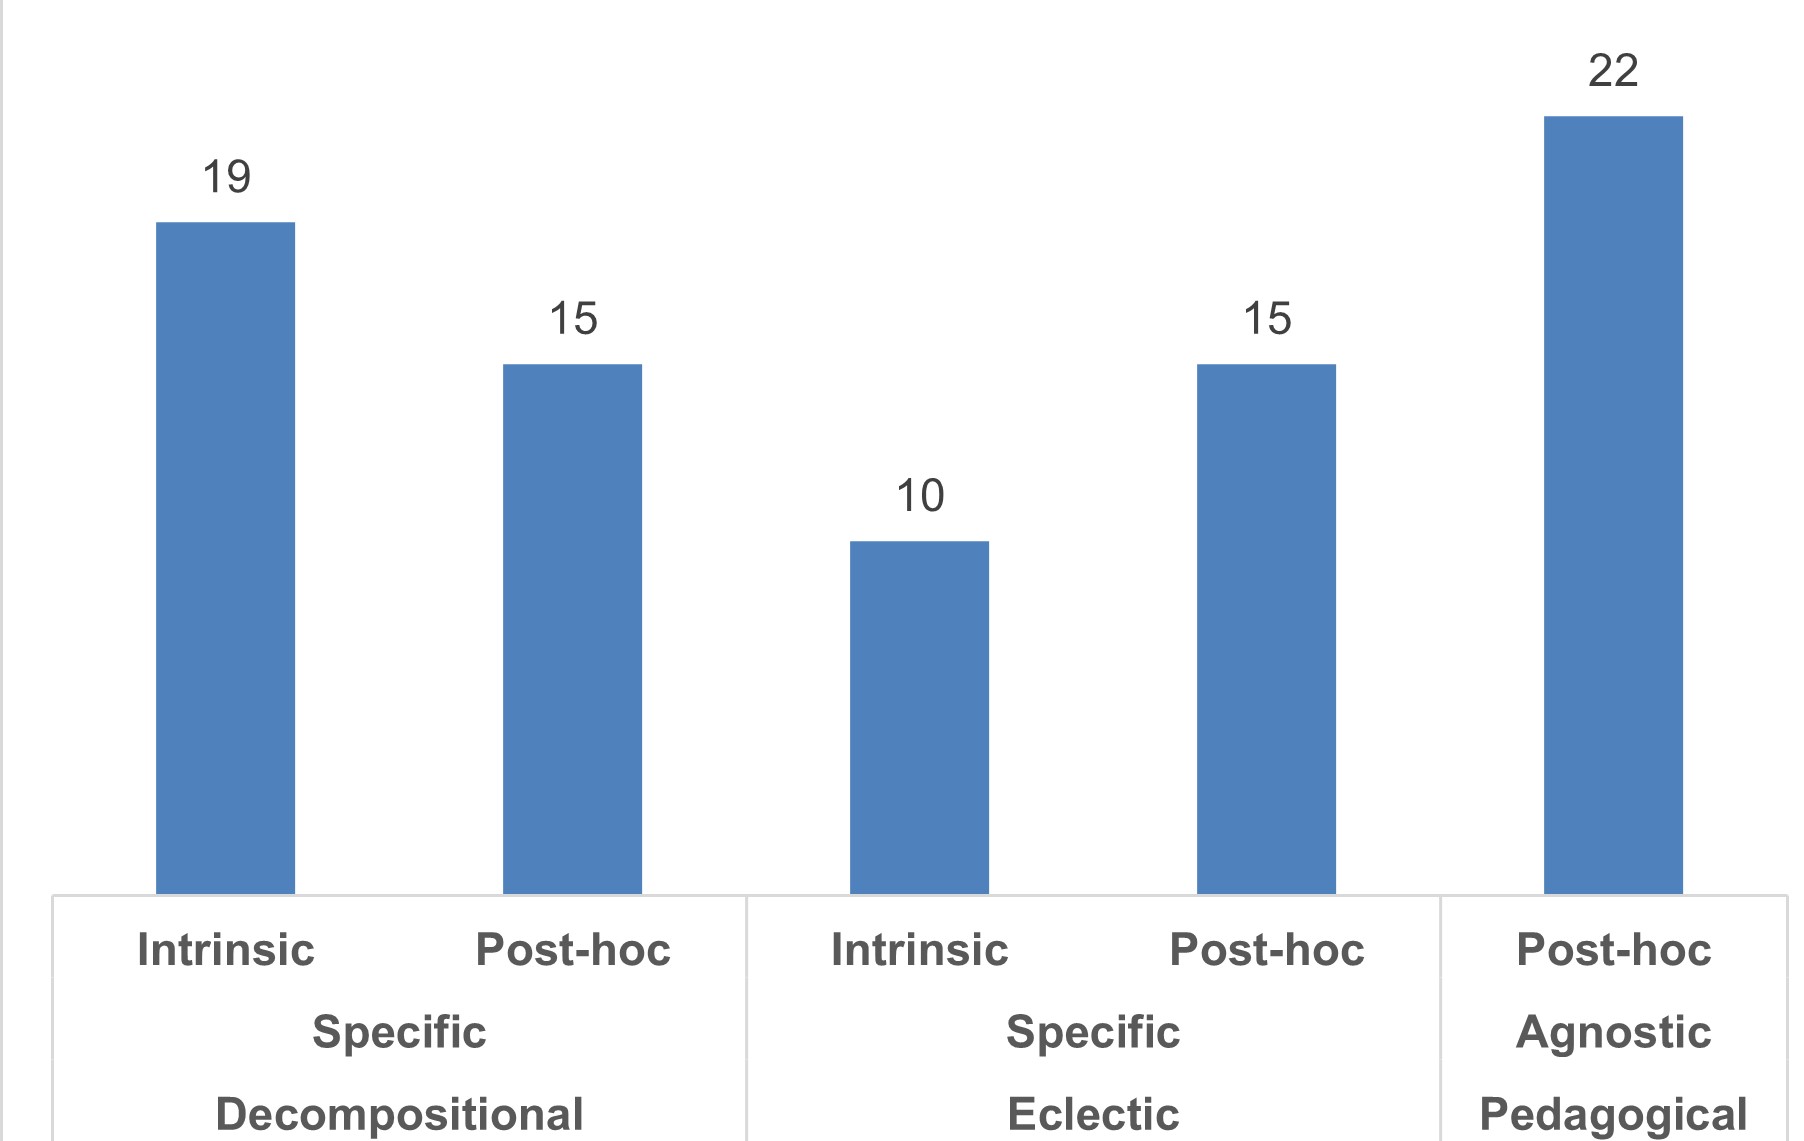
The image presents a bar chart comparing numerical values across six different categories. Each category is defined by two labels: one indicating a broader classification (Intrinsic, Post-hoc) and another specifying a more detailed attribute (Specific, Agnostic, etc.). The height of each bar represents a numerical value, displayed directly above the bar.
### Components/Axes
* **X-axis:** Represents the categories, labeled as follows:
* Intrinsic Decompositional
* Post-hoc Specific
* Intrinsic Eclectic
* Post-hoc Specific
* Post-hoc Agnostic Pedagogical
* **Y-axis:** Represents the numerical values, with an implicit scale ranging from 0 to at least 22. The scale is not explicitly labeled.
* **Bars:** Six vertical bars, each representing a category's value. All bars are the same color (blue).
* **Value Labels:** Numerical values are displayed above each bar, indicating the corresponding height.
### Detailed Analysis
The chart displays the following values for each category:
1. **Intrinsic Decompositional:** Value = 19
2. **Post-hoc Specific:** Value = 15
3. **Intrinsic Eclectic:** Value = 10
4. **Post-hoc Specific:** Value = 15
5. **Post-hoc Agnostic Pedagogical:** Value = 22
The bars are arranged horizontally, with each bar representing a distinct category. The highest value is 22 (Post-hoc Agnostic Pedagogical), and the lowest is 10 (Intrinsic Eclectic). The values for "Post-hoc Specific" are identical (15).
### Key Observations
* The "Post-hoc Agnostic Pedagogical" category has the highest value, significantly exceeding the others.
* The "Intrinsic Eclectic" category has the lowest value.
* The two "Post-hoc Specific" categories have the same value.
* The "Intrinsic Decompositional" value is notably higher than the "Intrinsic Eclectic" value.
### Interpretation
The data suggests a comparison of some metric across different approaches or classifications. The "Intrinsic" categories represent inherent qualities, while the "Post-hoc" categories represent qualities assessed after the fact. The specific attributes (Decompositional, Specific, Eclectic, Agnostic Pedagogical) further refine these classifications.
The significantly higher value for "Post-hoc Agnostic Pedagogical" suggests that this approach yields the highest result according to the measured metric. The equal values for the two "Post-hoc Specific" categories indicate consistency in results for that specific approach. The lower value for "Intrinsic Eclectic" might indicate that this inherent quality is less pronounced or less effective in the context of the measurement.
Without knowing the specific metric being measured, it's difficult to draw definitive conclusions. However, the chart clearly demonstrates a ranking of the different categories based on their values, highlighting the relative strengths and weaknesses of each approach. The chart is a simple visual representation of comparative data, and does not contain any complex statistical analysis or additional information beyond the values themselves.