## Chart Type: Multiple Line Graphs
### Overview
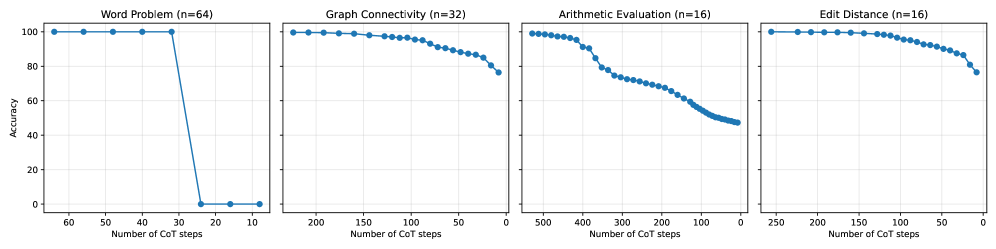
The image presents four line graphs arranged horizontally, each depicting the relationship between the "Number of CoT steps" (Chain of Thought steps) and "Accuracy" for different tasks: Word Problem, Graph Connectivity, Arithmetic Evaluation, and Edit Distance. Each graph also indicates the sample size (n) used for the experiment. The x-axis represents the number of CoT steps, and the y-axis represents accuracy, ranging from 0 to 100.
### Components/Axes
* **Titles:**
* Top-left: "Word Problem (n=64)"
* Top-middle-left: "Graph Connectivity (n=32)"
* Top-middle-right: "Arithmetic Evaluation (n=16)"
* Top-right: "Edit Distance (n=16)"
* **Y-axis:**
* Label: "Accuracy"
* Scale: 0, 20, 40, 60, 80, 100
* **X-axis:**
* Label: "Number of CoT steps"
* Word Problem: 10, 20, 30, 40, 50, 60
* Graph Connectivity: 0, 50, 100, 150, 200
* Arithmetic Evaluation: 0, 100, 200, 300, 400, 500
* Edit Distance: 0, 50, 100, 150, 200, 250
* **Grid:** Each graph has a light gray grid.
### Detailed Analysis
**1. Word Problem (n=64)**
* **Trend:** The accuracy remains at 100% until approximately 30 CoT steps, after which it drops sharply to 0%.
* **Data Points:**
* 60 CoT steps: 100%
* 50 CoT steps: 100%
* 40 CoT steps: 100%
* 30 CoT steps: 100%
* 20 CoT steps: 0%
* 10 CoT steps: 0%
**2. Graph Connectivity (n=32)**
* **Trend:** The accuracy starts near 100% and gradually decreases as the number of CoT steps decreases.
* **Data Points (approximate):**
* 200 CoT steps: ~99%
* 150 CoT steps: ~98%
* 100 CoT steps: ~95%
* 50 CoT steps: ~90%
* 0 CoT steps: ~80%
**3. Arithmetic Evaluation (n=16)**
* **Trend:** The accuracy starts near 100% and decreases significantly as the number of CoT steps decreases. The drop is not linear; there are steeper declines in certain regions.
* **Data Points (approximate):**
* 500 CoT steps: ~99%
* 400 CoT steps: ~95%
* 300 CoT steps: ~70%
* 200 CoT steps: ~60%
* 100 CoT steps: ~50%
* 0 CoT steps: ~47%
**4. Edit Distance (n=16)**
* **Trend:** The accuracy starts near 100% and gradually decreases as the number of CoT steps decreases.
* **Data Points (approximate):**
* 250 CoT steps: ~99%
* 200 CoT steps: ~98%
* 150 CoT steps: ~97%
* 100 CoT steps: ~95%
* 50 CoT steps: ~90%
* 0 CoT steps: ~80%
### Key Observations
* The "Word Problem" task exhibits a sharp threshold effect, where accuracy is high until a certain number of CoT steps, then drops to zero.
* "Graph Connectivity," "Arithmetic Evaluation," and "Edit Distance" tasks show a more gradual decline in accuracy as the number of CoT steps decreases.
* The "Arithmetic Evaluation" task shows the most significant drop in accuracy as the number of CoT steps decreases.
* The sample size (n) varies across the tasks, which could influence the observed trends.
### Interpretation
The graphs suggest that the effectiveness of Chain of Thought (CoT) prompting varies depending on the task. For the "Word Problem" task, a certain minimum number of CoT steps is crucial for achieving high accuracy; below this threshold, the model fails completely. For the other tasks, the relationship is more nuanced, with accuracy gradually decreasing as the number of CoT steps is reduced. This could indicate that these tasks benefit from a more extensive reasoning process, but can still achieve some level of success with fewer steps. The "Arithmetic Evaluation" task appears to be the most sensitive to the number of CoT steps, suggesting it requires more in-depth reasoning than the other tasks. The different sample sizes (n) should be considered when comparing the results across tasks, as larger sample sizes generally provide more reliable estimates of performance.