\n
## Line Charts: Accuracy vs. Number of CoT Steps for Different Tasks
### Overview
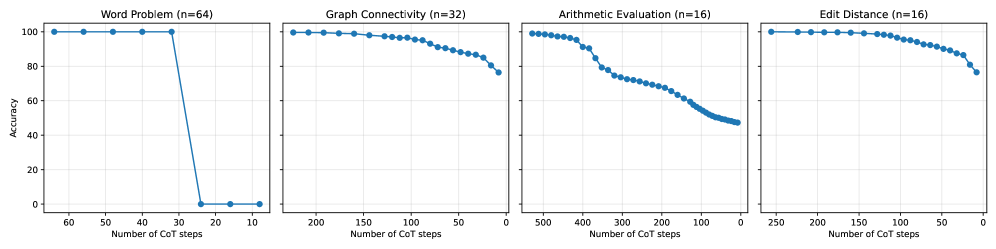
The image presents four separate line charts, each depicting the relationship between accuracy and the number of Chain-of-Thought (CoT) steps for a different task. The tasks are: Word Problem, Graph Connectivity, Arithmetic Evaluation, and Edit Distance. Each chart includes a sample size (n) indicated in the title.
### Components/Axes
Each chart shares the following components:
* **X-axis:** "Number of CoT steps", ranging from 0 to 60 (Word Problem), 0 to 200 (Graph Connectivity), 0 to 500 (Arithmetic Evaluation), and 0 to 250 (Edit Distance). The scale is linear.
* **Y-axis:** "Accuracy", ranging from 0 to 100, representing percentage accuracy. The scale is linear.
* **Data Series:** A single blue line with circular data points representing the accuracy for each task at different CoT step counts.
* **Titles:** Each chart has a title indicating the task and the sample size (n).
### Detailed Analysis or Content Details
**1. Word Problem (n=64)**
* **Trend:** The line starts at approximately 100% accuracy with a small number of CoT steps (around 60) and rapidly decreases to approximately 0% accuracy as the number of CoT steps decreases to 0. The accuracy appears to plateau at 0% for the lowest CoT step counts.
* **Data Points (approximate):**
* 60 CoT steps: ~100% accuracy
* 40 CoT steps: ~90% accuracy
* 30 CoT steps: ~60% accuracy
* 20 CoT steps: ~10% accuracy
* 10 CoT steps: ~0% accuracy
* 0 CoT steps: ~0% accuracy
**2. Graph Connectivity (n=32)**
* **Trend:** The line starts at approximately 100% accuracy with a small number of CoT steps (around 200) and gradually decreases to approximately 90% accuracy as the number of CoT steps decreases to 0. The decrease is relatively smooth.
* **Data Points (approximate):**
* 200 CoT steps: ~100% accuracy
* 150 CoT steps: ~98% accuracy
* 100 CoT steps: ~95% accuracy
* 50 CoT steps: ~92% accuracy
* 0 CoT steps: ~90% accuracy
**3. Arithmetic Evaluation (n=16)**
* **Trend:** The line starts at approximately 100% accuracy with a small number of CoT steps (around 500) and initially decreases slowly, then experiences a more rapid decline to approximately 50% accuracy around 200 CoT steps. It continues to decrease, reaching approximately 0% accuracy at 0 CoT steps.
* **Data Points (approximate):**
* 500 CoT steps: ~100% accuracy
* 400 CoT steps: ~95% accuracy
* 300 CoT steps: ~80% accuracy
* 200 CoT steps: ~50% accuracy
* 100 CoT steps: ~20% accuracy
* 0 CoT steps: ~0% accuracy
**4. Edit Distance (n=16)**
* **Trend:** The line starts at approximately 100% accuracy with a small number of CoT steps (around 250) and gradually decreases to approximately 80% accuracy as the number of CoT steps decreases to 0. The decrease is relatively smooth.
* **Data Points (approximate):**
* 250 CoT steps: ~100% accuracy
* 200 CoT steps: ~95% accuracy
* 150 CoT steps: ~90% accuracy
* 100 CoT steps: ~85% accuracy
* 50 CoT steps: ~82% accuracy
* 0 CoT steps: ~80% accuracy
### Key Observations
* The Word Problem task shows the most significant decrease in accuracy as the number of CoT steps decreases.
* Graph Connectivity and Edit Distance exhibit relatively stable accuracy levels even with fewer CoT steps.
* Arithmetic Evaluation shows a more complex relationship, with a gradual decline followed by a steeper drop in accuracy.
* The sample sizes (n) vary across tasks, which could influence the observed trends.
### Interpretation
The data suggests that the effectiveness of Chain-of-Thought prompting varies significantly depending on the task. Word Problems appear to be highly sensitive to the number of CoT steps, requiring a substantial number of steps to maintain high accuracy. In contrast, Graph Connectivity and Edit Distance are more robust and maintain reasonable accuracy even with fewer CoT steps. Arithmetic Evaluation falls in between, showing a more nuanced relationship.
The differing sensitivities likely reflect the inherent complexity of each task. Word Problems often require multiple reasoning steps to arrive at a solution, making them more reliant on CoT. Graph Connectivity and Edit Distance may involve more straightforward algorithmic processes, reducing the need for extensive reasoning.
The varying sample sizes (n=64, n=32, n=16, n=16) introduce a potential confounding factor. Larger sample sizes generally provide more reliable estimates of accuracy. The lower sample sizes for Arithmetic Evaluation and Edit Distance might contribute to the observed variability in those tasks.
The charts demonstrate the importance of tailoring the number of CoT steps to the specific task at hand. Simply increasing the number of CoT steps does not guarantee improved performance and can even be detrimental for certain tasks, as seen in the Word Problem example. Further investigation with larger and more balanced sample sizes would be beneficial to confirm these findings and explore the optimal CoT strategy for each task.