## Line Charts: Accuracy vs. Number of Chain-of-Thought (CoT) Steps
### Overview
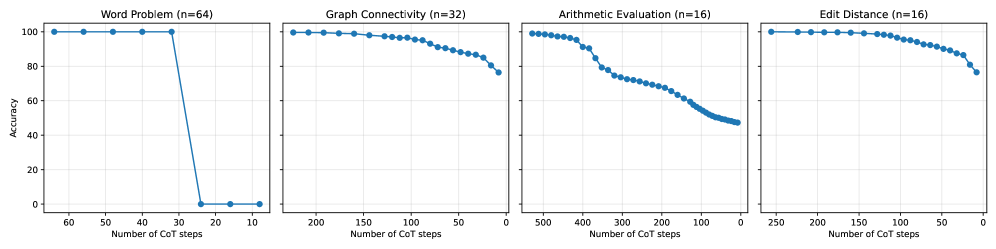
The image displays four separate line charts arranged horizontally. Each chart plots "Accuracy" (y-axis) against the "Number of CoT steps" (x-axis) for a different task or problem type. The x-axis is **reversed**, with values decreasing from left to right. All charts use blue lines with circular markers. The charts appear to be from a technical or research context, likely evaluating the performance of a reasoning model as the number of reasoning steps changes.
### Components/Axes
* **Common Y-Axis (All Charts):** Label: "Accuracy". Scale: 0 to 100, with major tick marks at 0, 20, 40, 60, 80, 100.
* **Common X-Axis (All Charts):** Label: "Number of CoT steps". The scale is reversed and varies per chart.
* **Chart Titles & Sample Sizes (n):**
1. **Leftmost Chart:** "Word Problem (n=64)"
2. **Second Chart:** "Graph Connectivity (n=32)"
3. **Third Chart:** "Arithmetic Evaluation (n=16)"
4. **Rightmost Chart:** "Edit Distance (n=16)"
* **Legend:** No separate legend is present. The task type is indicated by the title above each chart.
* **Spatial Layout:** The four charts are aligned in a single row. Each chart occupies an equal-width panel with a light gray grid in the background.
### Detailed Analysis
**Chart 1: Word Problem (n=64)**
* **X-Axis Range:** Approximately 65 to 5 (decreasing left to right).
* **Trend & Data Points:** The line shows a **sharp, cliff-like drop**. Accuracy is at or near 100% for a high number of CoT steps (from ~65 down to ~30). Between approximately 30 and 20 steps, accuracy plummets to near 0%. It remains at ~0% for step counts below 20 (down to ~5).
* **Key Values (Approximate):** At ~65 steps: 100%. At ~30 steps: 100%. At ~25 steps: ~0%. At ~5 steps: ~0%.
**Chart 2: Graph Connectivity (n=32)**
* **X-Axis Range:** Approximately 225 to 0 (decreasing left to right).
* **Trend & Data Points:** The line shows a **gradual, accelerating decline**. Accuracy starts very high (~98-100%) at the highest step count (~225). It decreases slowly at first, then more rapidly as the number of steps decreases, ending at approximately 75% accuracy at 0 steps.
* **Key Values (Approximate):** At ~225 steps: ~98%. At ~150 steps: ~95%. At ~75 steps: ~85%. At 0 steps: ~75%.
**Chart 3: Arithmetic Evaluation (n=16)**
* **X-Axis Range:** Approximately 550 to 0 (decreasing left to right).
* **Trend & Data Points:** The line shows a **steady, near-linear decline**. Accuracy begins near 100% at ~550 steps and falls consistently as steps decrease, ending at approximately 50% accuracy at 0 steps.
* **Key Values (Approximate):** At ~550 steps: ~98%. At ~400 steps: ~90%. At ~200 steps: ~70%. At 0 steps: ~50%.
**Chart 4: Edit Distance (n=16)**
* **X-Axis Range:** Approximately 250 to 0 (decreasing left to right).
* **Trend & Data Points:** The line shows a **gradual decline that steepens at the end**. Accuracy starts near 100% at ~250 steps, decreases slowly to about 90% at ~100 steps, then drops more sharply to approximately 75% at 0 steps.
* **Key Values (Approximate):** At ~250 steps: ~98%. At ~150 steps: ~92%. At ~50 steps: ~85%. At 0 steps: ~75%.
### Key Observations
1. **Reversed X-Axis:** All charts plot a higher number of CoT steps on the left and a lower number on the right. This visually represents "reducing steps" from left to right.
2. **Universal Negative Correlation:** In all four tasks, accuracy is positively correlated with the number of CoT steps. Fewer steps lead to lower accuracy.
3. **Task-Dependent Sensitivity:** The *rate* and *pattern* of decline vary significantly by task:
* **Word Problems** exhibit a catastrophic failure mode after a critical step threshold (~30 steps).
* **Graph Connectivity** and **Edit Distance** show more graceful degradation.
* **Arithmetic Evaluation** shows the most linear and predictable decline.
4. **Sample Size Variation:** The sample size (n) is largest for Word Problems (64) and smallest for Arithmetic Evaluation and Edit Distance (16 each), which may affect the smoothness and reliability of the curves.
### Interpretation
The data strongly suggests that **Chain-of-Thought (CoT) reasoning is crucial for maintaining high accuracy across these diverse problem types.** The number of reasoning steps acts as a key performance resource.
* **The "Cliff" in Word Problems** indicates a potential **phase transition or minimum complexity threshold**. Below a certain number of steps (~30), the model likely cannot construct a coherent solution path, causing performance to collapse entirely. This is a critical finding for reliability.
* **The Gradual Declines** in the other tasks imply that while more steps are beneficial, the model can still perform reasonably well with suboptimal step counts, albeit with degrading performance. The steeper final drop in Edit Distance might suggest a secondary threshold for that specific task.
* **The Linear Decline in Arithmetic** is noteworthy. It suggests a direct, proportional relationship between the allocated reasoning "budget" (steps) and success rate for this task, making it potentially more predictable.
* **Practical Implication:** For real-world applications, these charts argue for **dynamically allocating or encouraging more reasoning steps**, especially for complex word problems, to avoid catastrophic failure. The optimal number of steps is task-dependent. The reversed axis cleverly visualizes the cost (in accuracy) of *reducing* computational effort (steps).