# Roofline Model (Llama 33B, A40) Analysis
## Axes and Labels
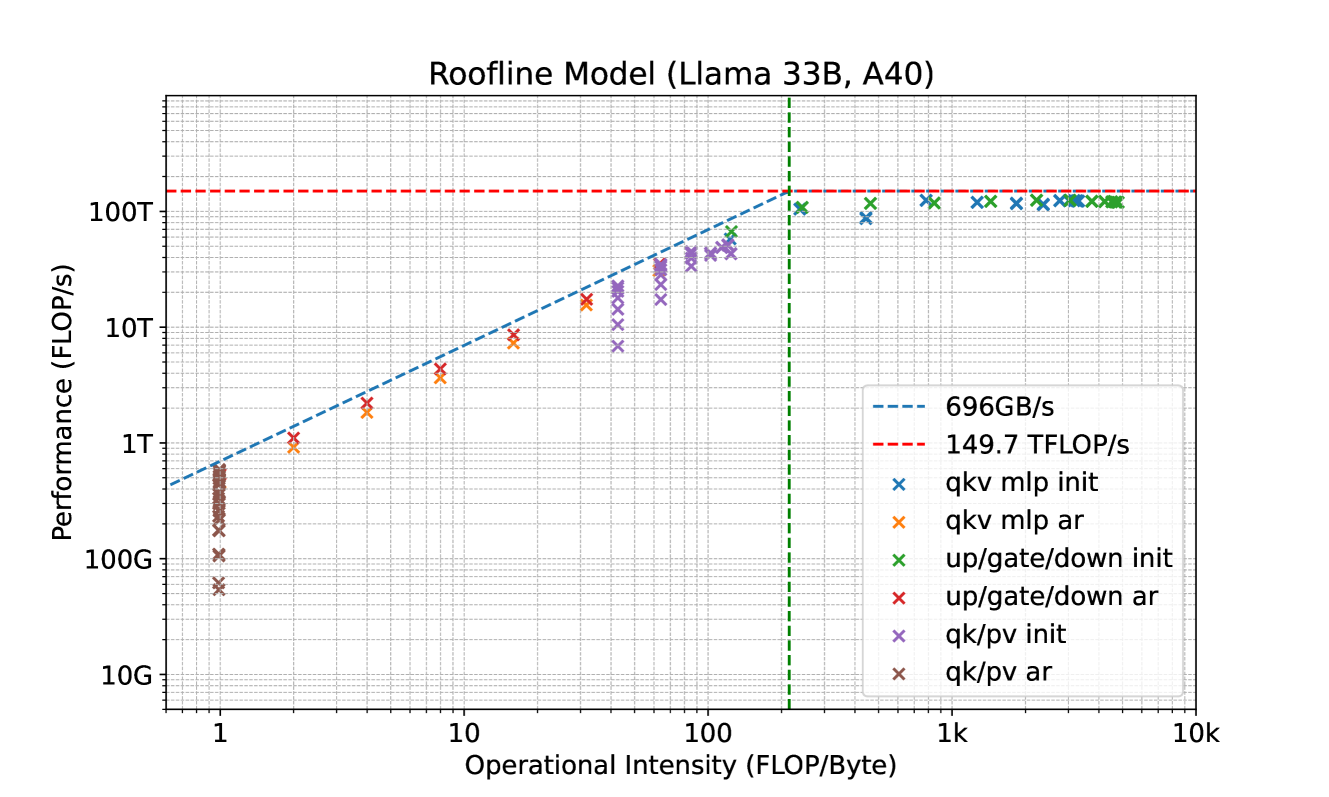
- **X-Axis**: Operational Intensity (FLOP/Byte)
- Range: 1 to 10,000 (logarithmic scale)
- Gridlines: Logarithmic spacing
- **Y-Axis**: Performance (FLOP/s)
- Range: 10G (10^9) to 100T (10^14) (logarithmic scale)
- Gridlines: Logarithmic spacing
## Legend and Key Trends
1. **Memory Bandwidth Limit**
- **Line**: Dashed blue line
- **Value**: 696GB/s
- **Interpretation**: Represents the maximum data transfer rate (memory-bound performance ceiling).
2. **Compute Limit**
- **Line**: Red dashed line
- **Value**: 149.7 TFLOP/s
- **Interpretation**: Theoretical peak performance (compute-bound ceiling).
3. **Data Points**
- **Markers**: Colored "X" symbols for different operations:
- **Blue**: `qkv mlp init`
- **Orange**: `qkv mlp ar`
- **Green**: `up/gate/down init`
- **Red**: `up/gate/down ar`
- **Purple**: `qk/pv init`
- **Brown**: `qk/pv ar`
## Performance Trends
- **Operational Intensity vs. Performance**:
- Performance increases linearly with operational intensity until it reaches the **memory bandwidth limit** (696GB/s).
- Beyond this point, performance plateaus, constrained by memory bandwidth.
- The red dashed line (149.7 TFLOP/s) represents the theoretical maximum performance, which is not exceeded by any data point.
## Critical Observations
- **Memory-Bound Operations**:
- Data points for `qkv mlp init`, `qkv mlp ar`, and `up/gate/down init` cluster near the memory bandwidth limit, indicating these operations are memory-bound.
- **Compute-Bound Operations**:
- `up/gate/down ar`, `qk/pv init`, and `qk/pv ar` approach but do not exceed the compute limit (149.7 TFLOP/s).
- **Efficiency**:
- The roofline model illustrates the trade-off between operational intensity and performance, highlighting hardware constraints (memory bandwidth and compute capacity).
## Grid and Annotations
- **Dashed Lines**:
- Vertical green dashed line at 696GB/s (memory bandwidth).
- Horizontal red dashed line at 149.7 TFLOP/s (compute limit).
- **Grid**: Logarithmic scale for both axes to visualize performance across orders of magnitude.