\n
## Diagram: Tree-like Structure with Weighted Edges
### Overview
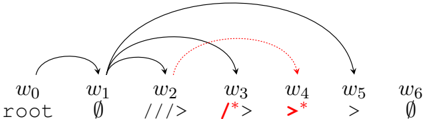
The image depicts a directed, tree-like diagram with nodes labeled `w0` through `w6`. The diagram illustrates relationships between these nodes via directed edges, some of which are weighted (indicated by symbols). The root node is `w0`.
### Components/Axes
The diagram consists of:
* **Nodes:** `w0`, `w1`, `w2`, `w3`, `w4`, `w5`, `w6`.
* **Edges:** Directed lines connecting the nodes. Some edges are solid black lines, while others are dashed red lines.
* **Labels:** Each node is labeled with its identifier (`w0` - `w6`). The root node is additionally labeled "root".
* **Edge Weights:** The edges `w0` to `w3` and `w0` to `w4` have weights indicated by `*` symbols.
### Detailed Analysis or Content Details
The diagram can be described as follows:
* `w0` (labeled "root") has outgoing edges to `w1`, `w2`, `w3`, `w4`, and `w5`.
* `w1` has no outgoing edges. Its label is "∅".
* `w2` has no outgoing edges. Its label is "///>".
* `w3` has no outgoing edges. Its label is "/>*". The edge from `w0` to `w3` is dashed and red, and has a weight indicated by the asterisk `*`.
* `w4` has no outgoing edges. Its label is ">*". The edge from `w0` to `w4` is dashed and red, and has a weight indicated by the asterisk `*`.
* `w5` has no outgoing edges. Its label is ">".
* `w6` has no outgoing edges. Its label is "∅".
### Key Observations
* The diagram is a directed acyclic graph (DAG) resembling a tree.
* The root node `w0` is the source of all edges.
* The edges from `w0` to `w3` and `w0` to `w4` are visually distinguished by being dashed and red, and they are also marked with an asterisk, suggesting they have a special significance or weight.
* Nodes `w1` and `w6` have the same label "∅".
* The labels on the nodes appear to be some form of symbolic representation, potentially related to a specific domain or language.
### Interpretation
The diagram likely represents a hierarchical structure or a decision tree. The root node `w0` represents the starting point, and the subsequent nodes represent different paths or outcomes. The weighted edges (dashed red lines with asterisks) suggest that the paths to `w3` and `w4` are more important or have a higher cost/benefit than the other paths. The labels on the nodes could represent states, actions, or conditions within the system being modeled. The use of symbols like "∅", "///>", ">*", and ">" suggests a specialized notation, possibly related to a formal language or a specific algorithm. Without further context, it's difficult to determine the exact meaning of the diagram, but it clearly illustrates a branching structure with weighted relationships. The diagram could be a representation of a parse tree, a state machine, or a decision-making process.