## Line Graph: Performance Comparison of Rouge-L and Exact Metrics
### Overview
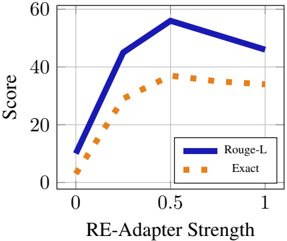
The image depicts a line graph comparing the performance scores of two metrics, **Rouge-L** (solid blue line) and **Exact** (dashed orange line), across varying **RE-Adapter Strength** values (0 to 1). The y-axis represents the "Score" (0–60), while the x-axis represents the "RE-Adapter Strength" (0–1). The legend is positioned in the bottom-right corner.
---
### Components/Axes
- **X-axis (Horizontal)**:
- Label: **RE-Adapter Strength**
- Scale: 0 (left) to 1 (right), with a midpoint marker at 0.5.
- **Y-axis (Vertical)**:
- Label: **Score**
- Scale: 0 (bottom) to 60 (top), with intermediate markers at 20, 40.
- **Legend**:
- Position: Bottom-right corner.
- Entries:
- **Rouge-L**: Solid blue line.
- **Exact**: Dashed orange line.
---
### Detailed Analysis
#### Rouge-L (Solid Blue Line)
- **Trend**:
- Starts at approximately **10** when RE-Adapter Strength = 0.
- Increases sharply to ~**45** at RE-Adapter Strength = 0.5.
- Slightly declines to ~**40** at RE-Adapter Strength = 1.
- **Key Data Points**:
- (0, ~10), (0.5, ~45), (1, ~40).
#### Exact (Dashed Orange Line)
- **Trend**:
- Starts at approximately **5** when RE-Adapter Strength = 0.
- Rises steadily to ~**35** at RE-Adapter Strength = 0.5.
- Remains flat at ~**35** at RE-Adapter Strength = 1.
- **Key Data Points**:
- (0, ~5), (0.5, ~35), (1, ~35).
---
### Key Observations
1. **Rouge-L outperforms Exact** across all RE-Adapter Strength values, with a maximum gap of ~10 points at RE-Adapter Strength = 0.5.
2. **Rouge-L peaks at 0.5** before declining slightly, suggesting diminishing returns at higher strengths.
3. **Exact plateaus at 0.5**, indicating no further improvement beyond this strength.
4. The gap between the two metrics narrows as RE-Adapter Strength increases, converging near 35–40 at RE-Adapter Strength = 1.
---
### Interpretation
- **Performance Dynamics**:
- Rouge-L’s sharp rise to 0.5 suggests it is highly sensitive to mid-range RE-Adapter Strength, potentially optimizing performance at this threshold.
- The slight decline after 0.5 may indicate overfitting or inefficiency at maximum strength.
- **Exact’s Behavior**:
- The flat performance after 0.5 implies that increasing RE-Adapter Strength beyond this point does not enhance Exact’s accuracy.
- **Practical Implications**:
- For applications prioritizing peak performance, Rouge-L at RE-Adapter Strength = 0.5 is optimal.
- The convergence at higher strengths suggests that both metrics may achieve similar utility in extreme cases, though Rouge-L remains superior overall.
- **Uncertainties**:
- Approximate values (e.g., ~10, ~45) reflect visual estimation due to unlabeled data points.
- The exact nature of the "Score" metric (e.g., BLEU, ROUGE) is unspecified, limiting interpretability.
---
### Final Notes
The graph highlights the trade-offs between Rouge-L and Exact metrics under varying RE-Adapter Strength. While Rouge-L demonstrates superior performance, its sensitivity to strength adjustments warrants further investigation into optimal configuration strategies.