\n
## Line Chart: RE-Adapter Strength vs. Score
### Overview
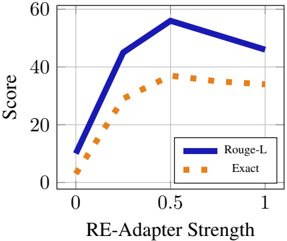
This image presents a line chart illustrating the relationship between "RE-Adapter Strength" and "Score" for two different metrics: "Rouge-L" and "Exact". The chart shows how the scores for both metrics change as the RE-Adapter Strength is varied from 0 to 1.
### Components/Axes
* **X-axis:** "RE-Adapter Strength" ranging from 0 to 1, with markers at 0, 0.5, and 1.
* **Y-axis:** "Score" ranging from 0 to 60, with markers at 0, 20, 40, and 60.
* **Legend:** Located in the top-right corner, containing two entries:
* "Rouge-L" – represented by a solid dark blue line.
* "Exact" – represented by an orange dashed line with square markers.
* **Gridlines:** Present to aid in reading values.
### Detailed Analysis
**Rouge-L (Dark Blue Line):**
The Rouge-L line slopes upward from a score of approximately 8 at RE-Adapter Strength 0, reaching a peak of approximately 54 at RE-Adapter Strength 0.5. It then declines to approximately 46 at RE-Adapter Strength 1.
* RE-Adapter Strength 0: Rouge-L Score ≈ 8
* RE-Adapter Strength 0.5: Rouge-L Score ≈ 54
* RE-Adapter Strength 1: Rouge-L Score ≈ 46
**Exact (Orange Dashed Line):**
The Exact line starts at approximately 2 at RE-Adapter Strength 0, rises to approximately 34 at RE-Adapter Strength 0.5, and then plateaus, remaining around 32-33 at RE-Adapter Strength 1.
* RE-Adapter Strength 0: Exact Score ≈ 2
* RE-Adapter Strength 0.5: Exact Score ≈ 34
* RE-Adapter Strength 1: Exact Score ≈ 32
### Key Observations
* Rouge-L score demonstrates a clear peak at RE-Adapter Strength 0.5, indicating an optimal strength for this metric.
* The Exact score increases with RE-Adapter Strength but does not exhibit the same pronounced peak as Rouge-L. It appears to plateau after RE-Adapter Strength 0.5.
* There is a significant difference in the magnitude of the scores between Rouge-L and Exact, with Rouge-L consistently achieving higher scores.
### Interpretation
The chart suggests that the RE-Adapter Strength has a notable impact on the Rouge-L score, with an optimal value around 0.5. Increasing the strength beyond this point leads to a decrease in performance, as measured by Rouge-L. The Exact score also benefits from increased RE-Adapter Strength, but the effect is less dramatic and appears to level off.
The difference in behavior between the two metrics suggests they capture different aspects of the model's performance. Rouge-L, which measures recall-oriented understudy for gisting evaluation, seems to be more sensitive to the RE-Adapter Strength, while the Exact metric, which likely measures exact match, is less affected.
The plateauing of the Exact score at higher RE-Adapter Strengths could indicate that the model is reaching a limit in its ability to generate exact matches, regardless of the adapter's influence. The decline in Rouge-L at RE-Adapter Strength 1 could be due to overfitting or a disruption of the model's ability to generalize.