## Line Chart: RE-Adapter Strength vs. Score
### Overview
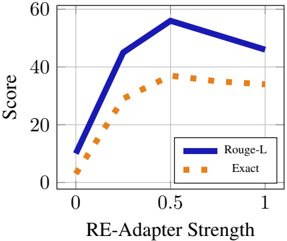
The image is a 2D line chart plotting two performance metrics ("Rouge-L" and "Exact") against a variable called "RE-Adapter Strength". The chart demonstrates how these scores change as the adapter strength increases from 0 to 1.
### Components/Axes
* **X-Axis (Horizontal):**
* **Label:** "RE-Adapter Strength"
* **Scale:** Linear scale from 0 to 1.
* **Major Tick Marks:** 0, 0.5, 1.
* **Y-Axis (Vertical):**
* **Label:** "Score"
* **Scale:** Linear scale from 0 to 60.
* **Major Tick Marks:** 0, 20, 40, 60.
* **Legend:**
* **Position:** Bottom-right corner of the chart area.
* **Series 1:** "Rouge-L" - Represented by a thick, solid blue line.
* **Series 2:** "Exact" - Represented by a dotted orange line.
### Detailed Analysis
**Data Series 1: Rouge-L (Solid Blue Line)**
* **Trend:** The line shows a sharp, concave-downward increase followed by a moderate decrease.
* **Data Points (Approximate):**
* At Strength = 0: Score ≈ 10
* At Strength ≈ 0.25: Score ≈ 45
* At Strength = 0.5: Score ≈ 55 (Peak)
* At Strength = 1: Score ≈ 45
**Data Series 2: Exact (Dotted Orange Line)**
* **Trend:** The line shows a steady, concave-downward increase followed by a slight plateau or very gentle decrease.
* **Data Points (Approximate):**
* At Strength = 0: Score ≈ 5
* At Strength ≈ 0.25: Score ≈ 25
* At Strength = 0.5: Score ≈ 35 (Peak)
* At Strength = 1: Score ≈ 30
### Key Observations
1. **Peak Performance:** Both metrics achieve their highest score at an RE-Adapter Strength of 0.5.
2. **Relative Performance:** The "Rouge-L" score is consistently higher than the "Exact" score across all measured strengths.
3. **Sensitivity:** The "Rouge-L" metric appears more sensitive to changes in adapter strength, showing a steeper initial rise and a more pronounced peak compared to the "Exact" metric.
4. **Post-Peak Behavior:** After the peak at 0.5, both scores decline as strength increases to 1.0, but the decline for "Rouge-L" is more significant.
### Interpretation
The chart suggests that the "RE-Adapter" has an optimal operating point at a strength of 0.5 for maximizing both evaluated metrics. The data indicates a classic "inverted-U" or "diminishing returns" relationship, where increasing the adapter's strength beyond the midpoint harms performance.
The consistent gap between the "Rouge-L" and "Exact" scores implies that the system being evaluated is better at generating responses that are semantically similar to a reference (measured by Rouge-L) than it is at generating verbatim or perfectly matching responses (measured by Exact match). The stronger reaction of the Rouge-L score to the adapter strength suggests the adapter's primary influence may be on the fluency or relevance of the output rather than its precise lexical accuracy.