# Technical Document Extraction: Model Accuracy vs. Generation Budget
## 1. Image Overview
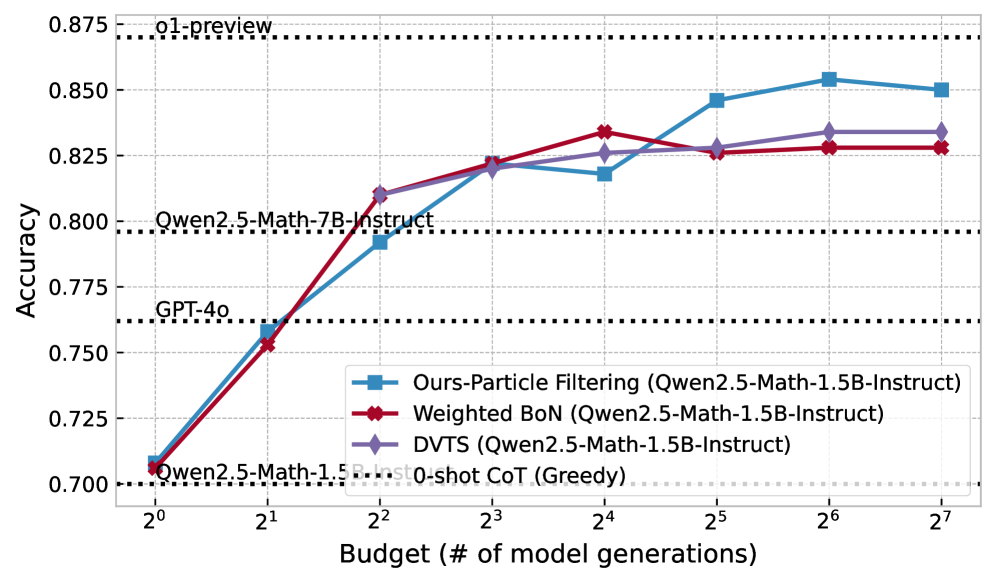
This image is a line graph illustrating the relationship between computational budget (measured in the number of model generations) and the accuracy of various Large Language Model (LLM) inference strategies. The chart compares three dynamic sampling/filtering methods against several static baselines.
## 2. Component Isolation
### A. Header / Reference Baselines
The top and middle sections of the chart contain horizontal black dotted lines representing fixed performance benchmarks for specific models:
* **o1-preview**: Positioned at approximately **0.870** accuracy.
* **Qwen2.5-Math-7B-Instruct**: Positioned at approximately **0.796** accuracy.
* **GPT-4o**: Positioned at approximately **0.762** accuracy.
* **Qwen2.5-Math-1.5B-Instruct 0-shot CoT (Greedy)**: Positioned at the baseline of **0.700** accuracy.
### B. Main Chart Area (Data Series)
The chart plots three primary data series using a logarithmic scale for the X-axis. All three series use **Qwen2.5-Math-1.5B-Instruct** as the base model.
**Legend:**
* **Blue Line with Square Markers (■):** Ours-Particle Filtering
* **Red Line with Cross/Diamond Markers (✖/◆):** Weighted BoN (Best-of-N)
* **Purple Line with Diamond Markers (◆):** DVTS
### C. Axes and Scale
* **Y-Axis (Vertical):** Labeled **"Accuracy"**. Scale ranges from **0.700 to 0.875** with increments of 0.025.
* **X-Axis (Horizontal):** Labeled **"Budget (# of model generations)"**. It uses a base-2 logarithmic scale: $2^0, 2^1, 2^2, 2^3, 2^4, 2^5, 2^6, 2^7$ (representing 1 to 128 generations).
## 3. Trend Verification and Data Extraction
| Budget ($2^n$) | Ours-Particle Filtering (Blue ■) | Weighted BoN (Red ✖) | DVTS (Purple ◆) |
| :--- | :--- | :--- | :--- |
| $2^0$ (1) | 0.708 | 0.706 | 0.706 |
| $2^1$ (2) | 0.759 | 0.753 | 0.753 |
| $2^2$ (4) | 0.792 | 0.810 | 0.810 |
| $2^3$ (8) | 0.822 | 0.822 | 0.821 |
| $2^4$ (16) | 0.818 | 0.834 | 0.826 |
| $2^5$ (32) | 0.846 | 0.826 | 0.828 |
| $2^6$ (64) | 0.854 | 0.828 | 0.834 |
| $2^7$ (128) | 0.850 | 0.828 | 0.834 |
## 4. Key Findings and Observations
1. **Scaling Efficiency:** All three methods significantly improve the performance of the 1.5B model. By a budget of $2^2$ (4 generations), the 1.5B model using any of these methods outperforms the much larger **GPT-4o** baseline.
2. **Surpassing Larger Models:** By a budget of $2^3$ (8 generations), all three methods outperform the **Qwen2.5-Math-7B-Instruct** model.
3. **Particle Filtering Superiority:** While Weighted BoN and DVTS perform similarly, the "Ours-Particle Filtering" method shows superior scaling at higher budgets (32+ generations), approaching the performance of the **o1-preview** model.
4. **Diminishing Returns:** The Weighted BoN method appears to plateau or slightly regress after 16 generations ($2^4$), whereas Particle Filtering and DVTS continue to show gains or stability.